
By David Enna, Tipswatch.com
Seasonally-adjusted U.S. inflation increased at a lower rate than expected in January, which should ease fears of an imminent price surge and help clear the path to future rate cuts by the Federal Reserve.
The Bureau of Labor Statistics reported Thursday that headline CPI increased 0.2% in January, less than the expected rate of 0.3%. Annual inflation dipped from 2.7% in December to 2.4%, the lowest annual number since May 2025.
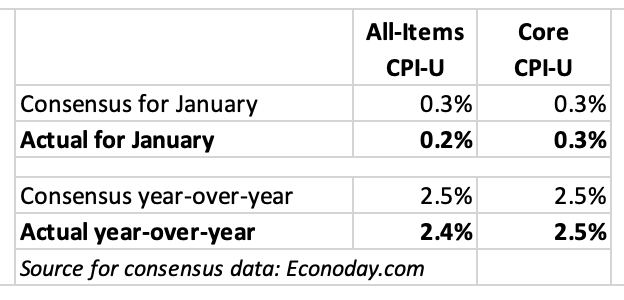
Core inflation, which removes food and energy, matched expectations at 0.3% for the month and 2.5% for the year. That’s down from 2.6% for December and the lowest annual core inflation rate since March 2021.
This January report represents mild inflation, which all Americans can welcome after the nation hit a 40-year high in inflation less than four years ago. But of course, there are qualifications to these numbers that need to be recognized.
Inflation watcher Michael Ashton did an excellent job of summarizing these issues in a posting Thursday on his E-piphany site. It is well worth reading, but I want to focus on his opening paragraphs:
A couple of months ago, we missed a CPI because of the shutdown. The BLS simply didn’t have any data to calculate the October 2025 CPI. That wasn’t the real problem. The real problem was that the BLS’s handbook of methods more or less forced it, in calculating the November CPI index, to assume unchanged prices for October for some large categories – in particular, rents. This caused a large, illusory decline in y/y inflation figures. Importantly, this was also temporary – there has been some catch-up but the big one comes in a few months when the OER rent survey rotation will cause a large offsetting jump in that category, exactly six months after the illusory dip. Until then, inflation numbers will be more difficult to interpret and the year-over-year numbers will be simply wrong. …
So when you read that today’s figure resulted in the “smallest y/y change in core inflation since 2021, and consistent with the Fed reaching its target” – that’s just wrong. … The CPI ‘fixings’ market is currently pricing headline CPI y/y to rise to 2.82% four months from now, and that isn’t because of a coming rebound in energy prices. …
The story in January 2026 is that the waters remain muddied by the government-shutdown-induced gap. The current y/y figures are all flattened by that event, and exaggerate how good the inflation picture is. That’s how the Administration can trumpet victory while the reality on the ground is that inflation is not converging to trend.
The inflation report
Some interesting items from the January report;
- Gasoline prices fell 3.2% for the month and are down 7.5% over the last year. That is an important factor in holding down all-items inflation.
- Shelter costs were up 0.2% for the month, fairly mild, and are now up 3.0% year over year. (Note that the shelter index is being skewed lower by missing October data.)
- Food at home prices rose 0.2% in January after rising 0.6% in December. They are up only 2.1% over the last 12 months, the BLS said.
- Costs for used cars and trucks fell 1.8% in January and are now down 2.0% for the year.
- Prices for new cars rose only 0.1% for the month and 0.4% for the year. (Some of this may be caused by “shrinkflation” of standard features on new cars, as I discussed in a Dec. 3, 2025, post.
- The index for airline fares increased 6.5% for the month, but only 2.2% for the year.
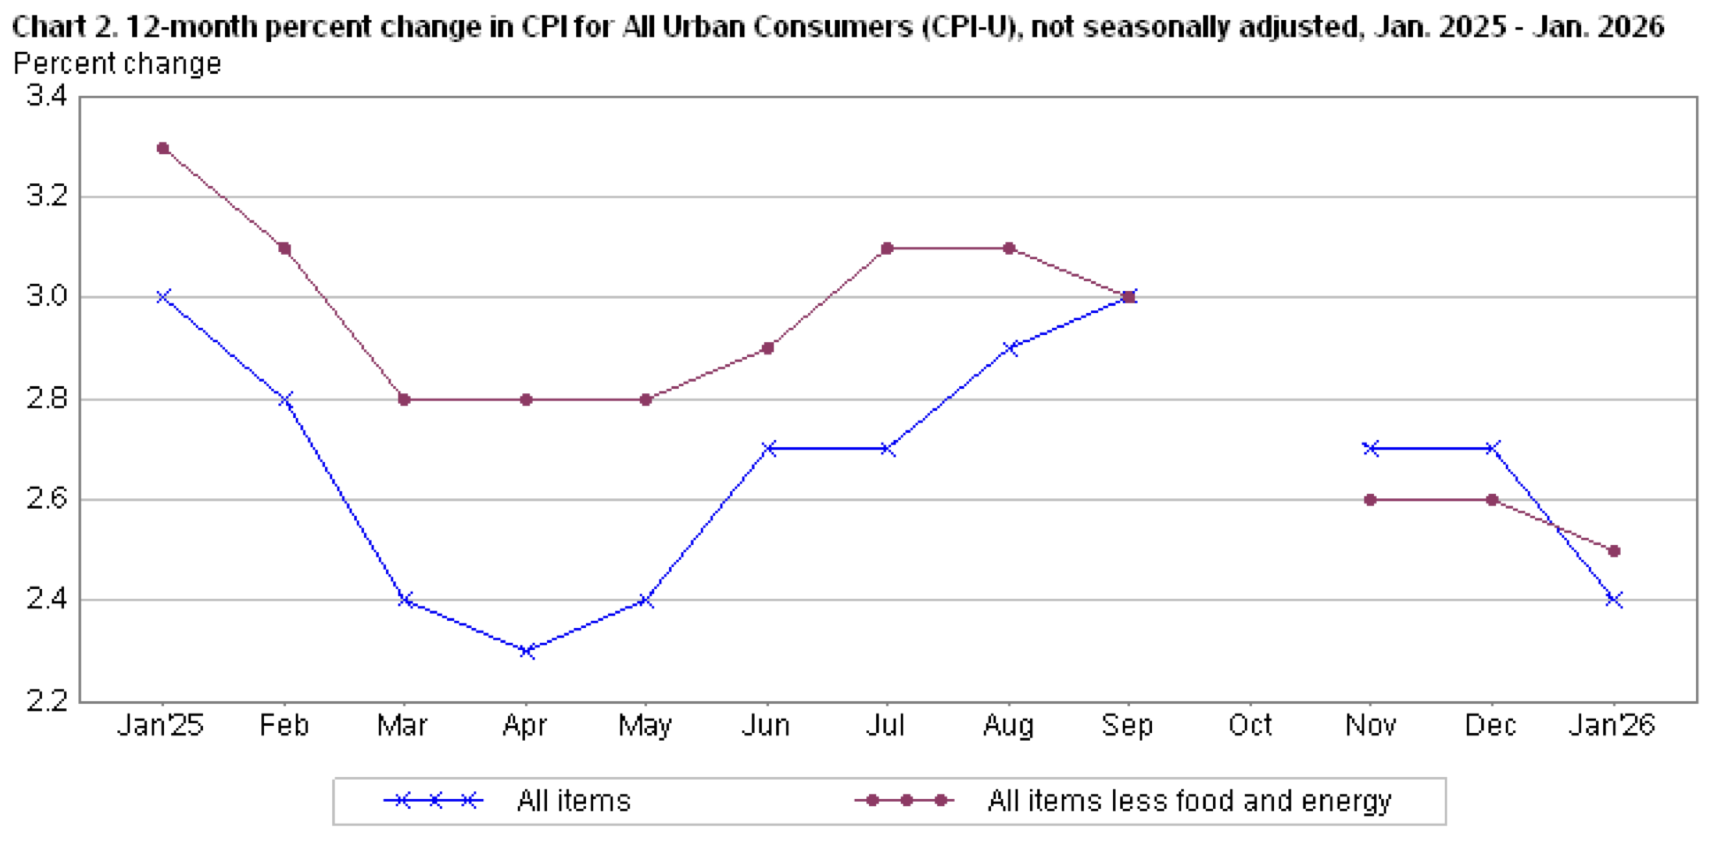
Here is the trend in all-items and core inflation over the last year, with the “mysterious October gap” dividing relatively high inflation of late summer 2025 from the more recent trend of mild inflation:
What this means for TIPS and I Bonds
Investors in Treasury Inflation-Protected Securities and U.S. Series I Savings Bonds are also interested in non-seasonally adjusted inflation, which is used to adjust principal balances on TIPS and set future interest rates for I Bonds.
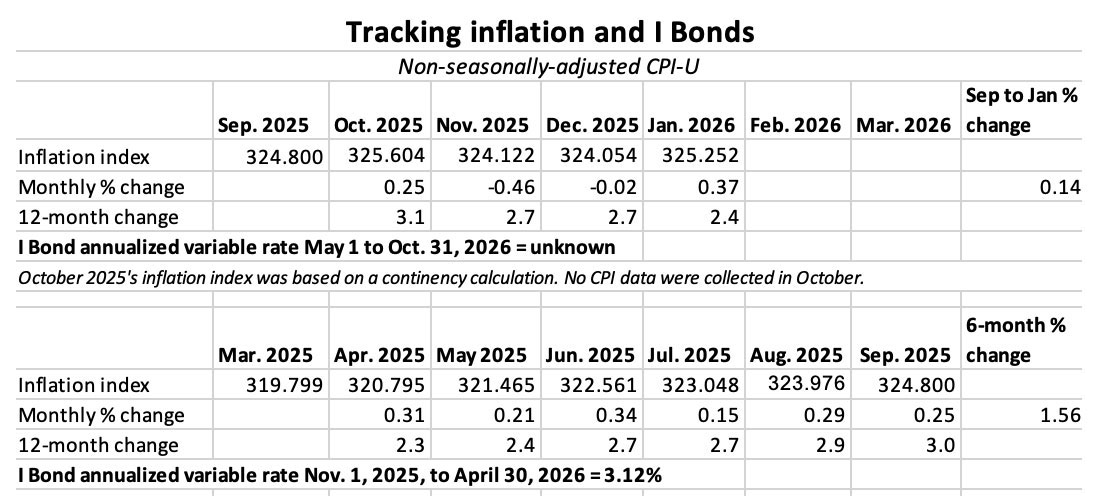
For January, the BLS set the CPI index at 325.252, an increase of 0.37% from the December number.
For TIPS. The January inflation index means that principal balances for all TIPS will increase 0.37% in March, after falling 0.02% in February. Here are the new March inflation indexes for all TIPS.
For I Bonds. January was the fourth month of a six-month string that will determine the I Bond’s new variable rate, which will be reset on May 1. At this point, four months in, inflation has increased only 0.14%, which would translate to a variable rate of 0.28%. Most likely we will be getting a new variable rate of about 1.4%, down from the current 3.12%. But a lot of things can change in the next two months.
Here are the data so far:
What this means for future interest rates
My thinking is that the Fed has clearly signaled it wants to pause interest rate cuts, possibly through the end of Chairman Jerome Powell’s term in May. This is from the Wall Street Journal:
With unemployment low, a somewhat muted rise in prices likely isn’t enough on its own to get the Federal Reserve to resume interest-rate cuts, because officials may want several more months of evidence that price pressures are moderating and that businesses aren’t passing along higher costs from tariffs.
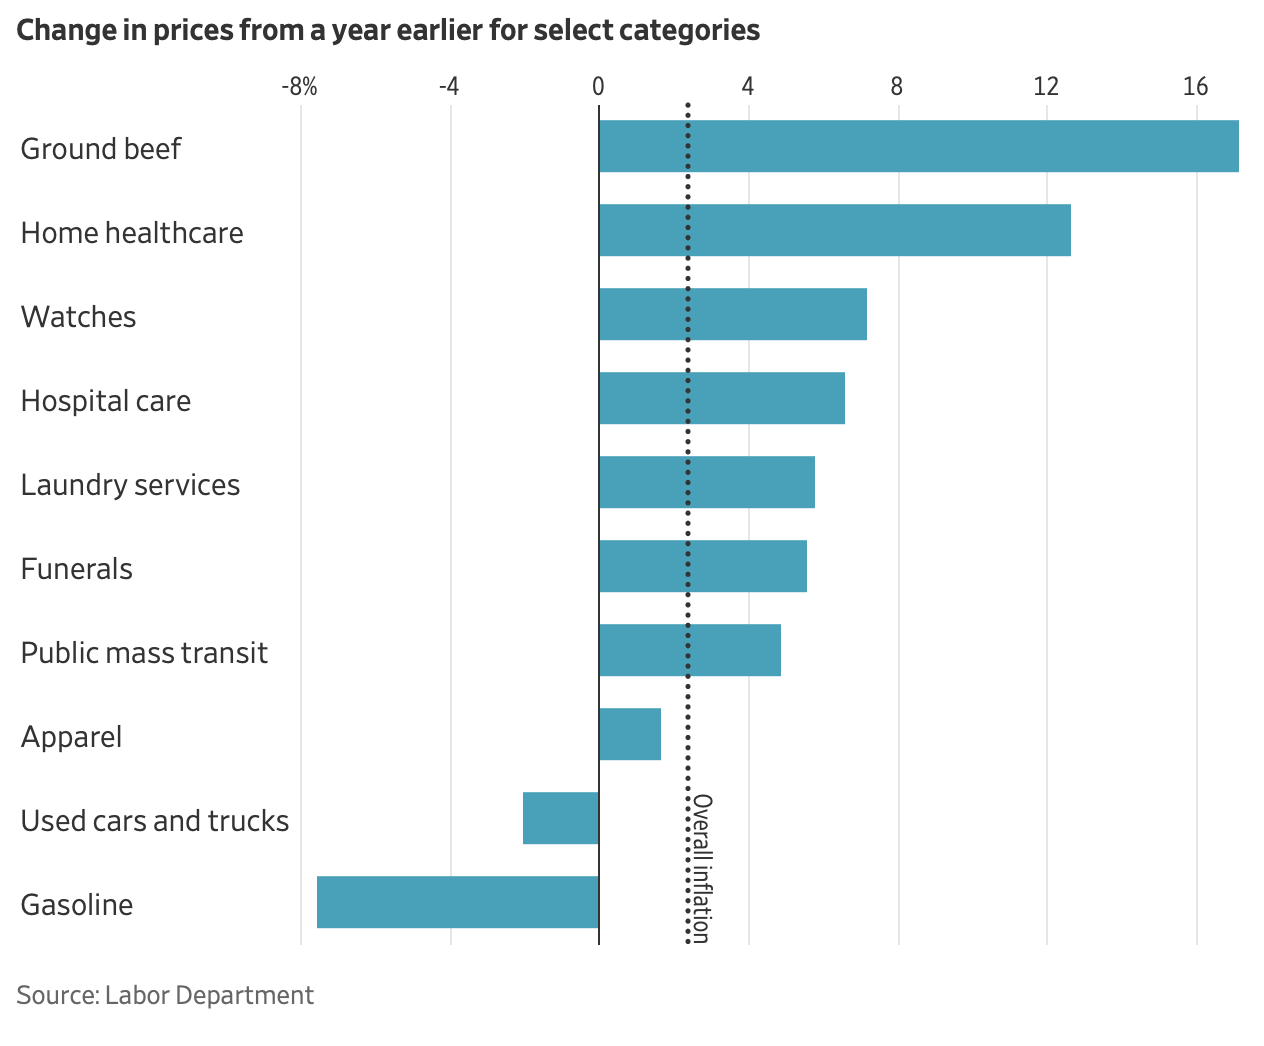
The Journal included this rather pointed graphic to demonstrate that prices are not falling in many important consumer areas:
The White House cheered the January report as good news, and a trend toward milder inflation is to be welcomed. But now, unfortunately, too many people question the validity of these inflation and jobs reports. That’s a dangerous trend for financial markets.
I think we can expect to see interest-rate cuts in 2026, but not in the near term.
—————————

Donate? This site is free and I plan to keep it that way. Some readers have suggested having a way to contribute. I would welcome donations. Any amount, or skip it, your choice. This is completely optional.
—————————
Follow Tipswatch on X for updates on daily Treasury auctions and real yield trends (when I am not traveling).
Feel free to post comments or questions below. If it is your first-ever comment, it will have to wait for moderation. After that, your comments will automatically appear. Please stay on topic and avoid political tirades. NOTE: Comment threads can only be three responses deep. If you see that you cannot respond, create a new comment and reference the topic.
David Enna is a financial journalist, not a financial adviser. He is not selling or profiting from any investment discussed. I Bonds and TIPS are not “get rich” investments; they are best used for capital preservation and inflation protection. They can be purchased through the Treasury or other providers without fees, commissions or carrying charges. Please do your own research before investing.

An analysis by The Wall Street Journal identified multiple instances of companies raising prices on items ranging from jeans to spices this year, after holding off as long as possible.
Many of these companies have had to increase their prices by high single-digit percentage points, well above the current inflation rate of 2.4 percent. The Adobe Digital Price Index found that online prices posted their largest monthly increase in more than a decade in January.
https://finance.yahoo.com/news/companies-set-unleash-sweeping-price-132937338.html
”For January, the BLS set the CPI index at 325.252, an increase of 0.37% from the December number.”. And that is what I see, ie extrapolated to 12 months is over 4%…that’s the trend line. And waiting to April to buy ignores the advantages of the one year hold requirement
I wouldn’t use the January number to extrapolate a year because non seasonally adjusted inflation runs higher at the beginning of the year. Is 4% possible, yes. But we can’t say that so far.
Do you think 30‑year TIPS would be a good investment? The yield looks attractive, but the long maturity feels excessive to me. Are there alternative options you would recommend rigth now?
My buying decision would be more based on the likely fixed rate update instead of the variable rate. If the fixed rate looks likely to go down in May, I would buy in April and capture 6 months of the 4.03% composite rate.
I will be posting an analysis of the upcoming 30-year TIPS auction on Monday morning, EST. This is a delay of one day because of the late inflation report.
Koalafications. 😉
There seeks to be two major factors causing inflation to “appear” lower than it is. One is the 6-month rent data blip and the other is the price of gasoline.
The bar graph makes the reality clear. The price decrease in the cost of gasoline (which stems from the decrease in oil prices which was caused by the sharp increase in oil production by OPEC in the last few months of 2025 to regain market share) is the real data keeping the inflation number in check. Another way to say it is that gas prices have offset the impact of extreme tariffs in the overall numbers.
I read the article you linked and it is worth the full read. This caught my eye:
“One way to look at it is that y/y Core CPI, at 2.5%, is the lowest since March 2021. Another way to look at it is that the m/m Core was the third highest in the last year, and annualizes to 3.6%.”
And that is without the rent readjustment coming in a few months. If I added correctly, the few months takes us to the April CPI report due out in May which will be one month after the next I Bond inflation rate will be determined. It seems I Bond owners will take a hit with the next rate change and then a reversal in the fall. This dip could be an opportunity for those looking to exist there I Bond holding of less than five years three months into the lower rate to minimize the three month penalty.
Lastly, I try to look at inflarion from the point of view of an average consumer. If that person has a car and goes to the gas station, they will “feel” inflation is lower. when that consumer goes to the supermarket or shopping in a department store, they will “feel” inflation is worse than ever. Based on what is really going on, they would be right.
Ashton points to a jump coming in reported CPI six months after last November’s shutdown-induced data lapse. That jump would not show up in time for the May I Bond rate reset, which is likely to be depressed. It would, however, figure prominently in calculations for this coming November. Think you’ll be waiting until then for your annual buy?
The books are being cooked now. We all know that.
When I look at the 12 month graph, that is very apparent. I don’t believe the markets are fooled. Those of us who own TIPs and Ibonds are being shortchanged.
Truflation has inflation at 0.69%. I trust that measure more than your expert or the official numbers.
That’s fine for your personal use and belief. But Truflation is meaningless when it comes to Fed decisions, TIPS, I Bonds, Social Security COLA, etc.
Of course your are correct. My comment was mainly pointed at Michael Ashton’s commentary on the official figures.
Truflation, the Bitcoin of inflation data.
Thanks for your always insightful report. Perhaps you meant to say “mild inflation” in paragraph 4 (instead of mind inflation)?
Ah yes. Thanks for the alert