
By David Enna, Tipswatch.com
The new Federal Reserve chairman, Kevin Warsh, stood in front of reporters Wednesday afternoon and said:
For some households, businesses, and market professionals five years of high inflation have left a mistaken impression that’s hard to shake, that the Fed’s implicit inflation target was somehow above 2 percent. Let me reiterate, there is no soft inflation target. There is no soft implicit target, not on this committee’s watch. There’s only a target, and it’s 2 percent.
That seems pretty straightforward, ironically from the man who said as recently as June 17, “I tend to focus on the left of the decimal point. Well, the two is the left of the decimal point.” In other words, a month ago he wasn’t too concerned about the number to the right of the decimal point.
As was expected, the Federal Reserve’s Open Market Committee held short-term interest rates in the same range — 3.50% to 3.75% — they have been since Dec. 10, 2025. In the meantime, U.S. inflation has increased from 2.7% in December to 3.5% in June.
The “hold” decision was expected, but Warsh’s vague comments on Fed strategy spooked the stock and bond markets. Stocks fell sharply and longer-term Treasury yields rose to 19-year highs.
Warsh, who has said he wants to limit forecasts and communications from the Fed, noted the sharp increases in bond yields over the last six weeks, saying:
Nominal and real yields are materially higher across the Treasury curve. In fact, some of the increases in market interest rates between FOMC meetings are among the most significant in the last two decades. … Even while at some level we haven’t done much in 42 days, the markets have done quite a bit.
Prices reacted in real time to incoming information, and the reduction in forward guidance may have been a factor. … This is, in my view, a change for the better, and we’re just getting started.
In other words, let the bond market set the way. Fine. But it isn’t the lack of communication that is causing bond-market jitters, it is an apparently endless war with Iran, massive federal deficits, rising energy prices and huge corporate bond-market borrowing by AI-driven businesses.
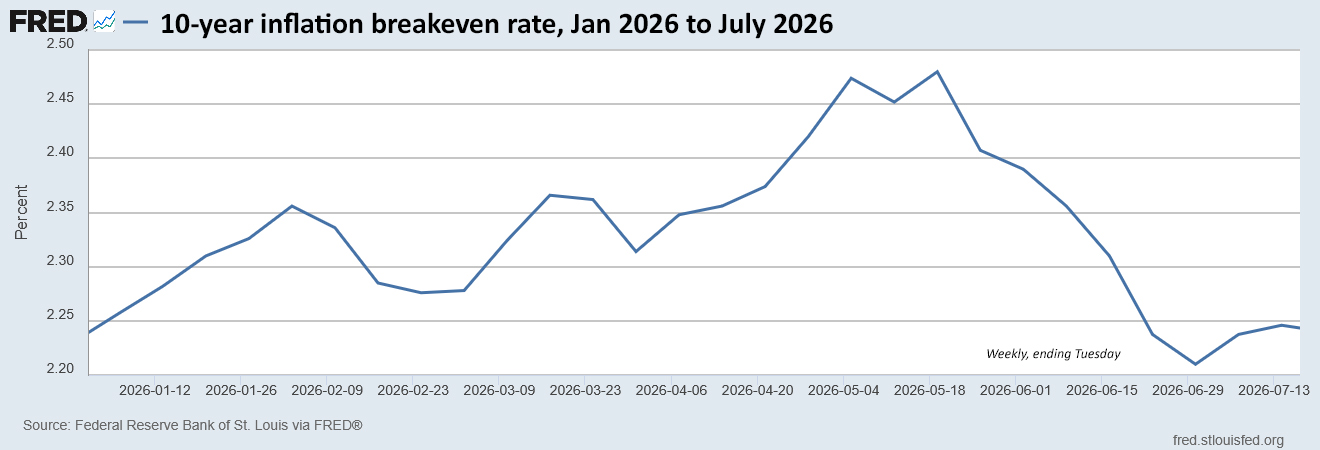
The Federal Reserve controls the short-term end of the bond market, where the U.S. Treasury has been shifting its borrowing in recent months because the short-term rate of about 3.75% is a lot more appealing than a 10-year note at 4.67%.
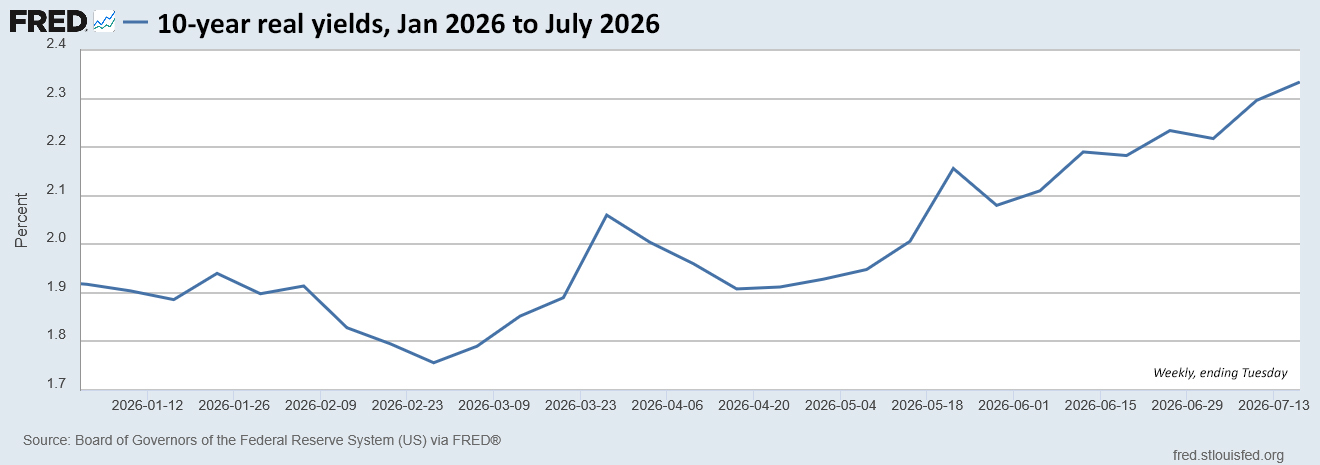
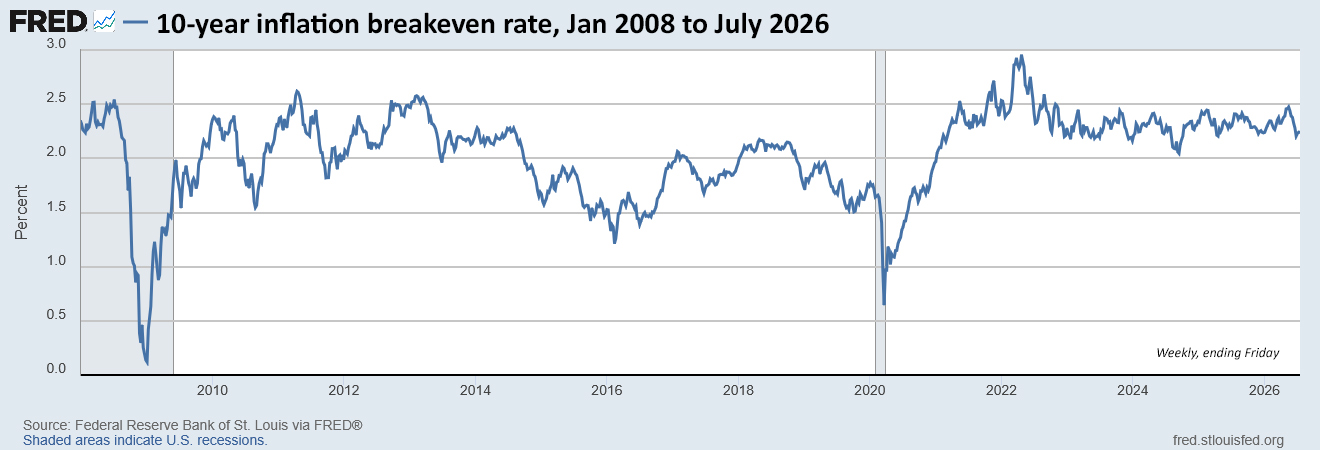
Take a look at this chart. After recent decisions to cut short-term interest rates, the longer-end of the Treasury curve has risen, sharply. The bond market is questioning the Fed’s credibility. In fact, I think an increase in short-term rates would cause longer-term yields to fall, not rise.

Traditionally, the yield of the 2-year note (currently 4.22%) is a good indicator of the direction for short-term rates, now 3.73%. That implies the market expects two 25-basis-point rate increases in coming months. But can Warsh deliver even one before the mid-term elections?
Just as the news conference was ending, President Trump was asked about the decision to hold short-term rates steady. He said:
Kevin’s fantastic. He’s a brilliant guy, smart. I know he’d love to see lower interest rates, but he’s got a board, and it’s a political board, and they want to keep rates up.
Trump didn’t do Warsh any favors. This harms Warsh’s credibility and calls Fed independence into question. But I think the fact that there were three dissenters in the Fed decision to hold was a good thing. All three wanted a rate increase. This sends the markets a message that there is strong debate on the open market committee.
Many times, Warsh delivers strong and inspiring statements on price stability, and then drifts into new ways of measuring inflation, replacing the Fed’s standard PCE index as a basis for rate decisions:
We’re going to deliver 2 percent inflation, and not a whisper more, but to achieve that I’m looking at a broader set of inflation data than PCE. So without sort of fully revealing my cards, I’m trying to understand, like my colleagues, what’s the underlying generalized change in prices that are happening in the economy. …
And so, if you would hear a message from me, yes, I care about what the PCE prints are. I care about what the contributions are from CPI and everything else. But my lens is broader than that.
This vagueness led Fed-watcher Claudia Sahm to write a post asking: “2% of what?” She wrote:
A half hour into the press conference, Paul Wiseman of the Associated Press asked the question:
WISEMAN: When you talk about the 2 percent inflation target, what measure are you relying on?WARSH: Yeah, so, I’ll give two answers. First let me give the proper standard answer, the Federal Reserve every January outlines a statement of purposes and strategy, and in that strategy document, which I believe was dated January of this year, it describes a measure of PCE inflation as the — as the objective function there. I have enough of my — so that’s our number, we’re sticking with it. … Who knows come after next January what we might say about strategy. I suspect the task forces might have something to add.
Sahm concludes, “Warsh is using PCE as the yardstick now, but he suggested he might pick a different inflation measure in January 2027. Choosing a new inflation measure that reads 2% is not achieving price stability; it’s destroying the Fed’s credibility.”
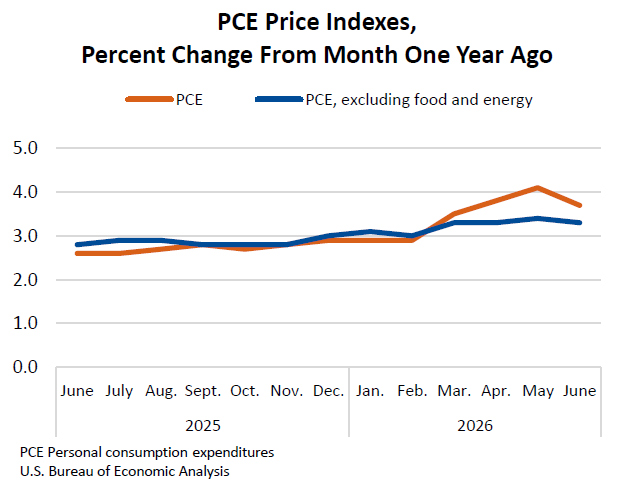
By the way, this is what PCE and core PCE look like as of the June 2026 report. Both remain above 3%, well off the Fed target:
This is what Warsh said about the difficulty of the task ahead:
We’ve got no magic wand. This isn’t something that we’re going to be able to carry out in days or weeks. …I want to leave you with the optimism of a new central banker that we’re committed as ever to deliver, and to offer an assurance we will.
The path ahead
While Warsh was speaking, the stock market began tanking, the dollar weakened and longer-term bond yields rose. “This is a classic central-bank credibility shock,” Mark Cabana, rates strategist at Bank of America, told the Wall Street Journal. And he added this key point:
“If you actually want to get long-end rates down, there’s an argument that you need to raise front-end rates right now in order to establish that credibility.”
FYI, Bank of America is projecting three rate hikes this year. My opinion: Won’t happen — not in a mid-term election year with a president ready to pounce and lay blame for any negative development.
I think Warsh will be fine in the long term, when he finds the right measure of openness and guidance. But this is a very difficult time.
The war with Iran, which seems to be broadening into a regional conflict, is a massively unpredictable factor. The Fed can do nothing to control rising oil prices and the shock that can spread across the economy.
This is very close to a crisis, and time for more specific communication from the Fed, not less. Saying nothing, even while talking 30 minutes to reporters, is not going to work.
Note: I won’t be writing this weekend. Attending a family reunion.
—————————

Donate? This site is free and I hope to keep it that way. Some readers have suggested having a way to contribute. I welcome donations, any amount. And FYI, ads on this site pay for about one visit to Costco.
—————————
Follow Tipswatch on X for updates on daily Treasury auctions and real yield trends (when I am not traveling).
Feel free to post comments or questions below. If it is your first-ever comment, it will have to wait for moderation. After that, your comments will automatically appear. Please stay on topic and avoid political tirades. NOTE: Comment threads can only be three responses deep. If you see that you cannot respond, create a new comment and reference the topic.
David Enna is a financial journalist, not a financial adviser. He is not selling or profiting from any investment discussed. I Bonds and TIPS are not “get rich” investments; they are best used for capital preservation and inflation protection. They can be purchased through the Treasury or other providers without fees, commissions or carrying charges. Please do your own research before investing.


if we average 2.03% for the 5 year TIPS from 8/3/26 to 10/30/26, then the 65% ratio will be 1.2514,…