
Back on Sept. 4 I posted ‘Why TIPS aren’t a good buy right now: A story in charts‘, in which tried to explain why the TIPS market looked a little out-of-whack, with TIPS yields dropping too low (and TIPS prices rising too high) against similar investments.
A LOT has happened since Sept. 4: 1) A weak inflation report, 2) the Federal Reserve hinting at higher interest rates possible by the end of next year, 3) a weak 10-year TIPS auction on Sept. 18, 4) a rise in Treasury yields and 5) a modest drop in the U.S. stock market.
No. 5 is especially interesting because Treasurys usually run counter to the stock market, especially during a strong decline. When stocks suddenly drop, fear rises and that usually pushes up demand for Treasurys, and results in lower yields.
So here is a comparison of how stocks (represented by the Standard and Poors 500 ETF) have performed over the last month versus TIPS (represented by the TIP ETF):
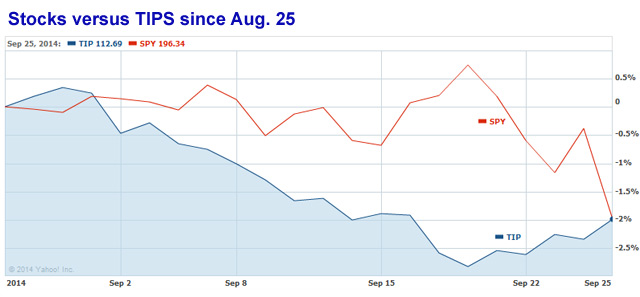 Remarkably, the overall performance has been very similar (down about 2% in a month), but the paths are pretty different. TIPS have gotten a small bump in the last few days as stocks dropped sharply. In fact, today’s trading, which isn’t reflected in that chart, has the TIP ETF down anther 0.5% and SPY is trading up 0.65%.
Inflation breakevens have been dropping. Investors seem to be signalling lower fear of future inflation, and that creates less demand for TIPS. Right now, according to Bloomberg’s Current Yields, a 10-year Treasury is trading at 2.53% while a 10-year TIPS is yielding 0.56%, creating a breakeven rate of 1.97%.
A month ago, on Aug. 27, the 10-year Treasury yield was 2.37% versus 0.23% for a 10-year TIPS, creating a breakeven rate of 2.14%.
So inflation expectations have dropped 17 basis points in a month, and this has been during a time of rising interest rates. That’s a double whammy for investors in TIPS mutual funds, and explains the nearly 2.5% drop in a month.
For buyers of TIPS, though, prices are beginning to look a lot more attractive.

Thanks Len. As I always say, ‘I am just a journalist.’ I try to watch the TIPS market carefully, and it’s funny that I seem to be the only journalist doing it.
As I recall you are a writer of some sort. Beyond that I find your insights pretty valuable even though I don’t believe in trying to predict the future from the past. You make a great deal more sense than what passes for analysis in WSJ or Barron’s. Well done.