
By David Enna, Tipswatch.com
In the messiest inflation report in history, the Bureau of Labor Statistics said today that seasonally-adjusted consumer prices rose just 0.2% over a two-month period (October and November), resulting in an annual rate of 2.7%
This is a two-month report because the BLS didn’t collect inflation data for October during the 43-day government shutdown. Plus, the November report was delayed by eight days. So we have been flying blind since the September report (also delayed) was issued on Oct. 24.
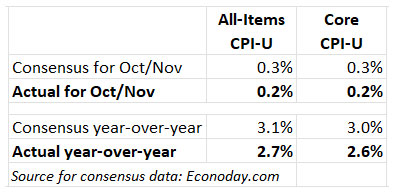
For what it is worth, this is a very encouraging inflation report, with both all-items and core inflation coming in well below expectations. The all-items annual rate fell from 3.0% to 2.7% and core inflation fell from 3.0% to 2.6%. This indicates a strong disinflationary trend. But the BLS did note:
BLS did not collect survey data for October 2025 due to a lapse in appropriations. BLS was unable to retroactively collect these data. For a few indexes, BLS uses nonsurvey data sources instead of survey data to make the index calculations. BLS was able to retroactively acquire most of the nonsurvey data for October. CPI data collection resumed on November 14, 2025.
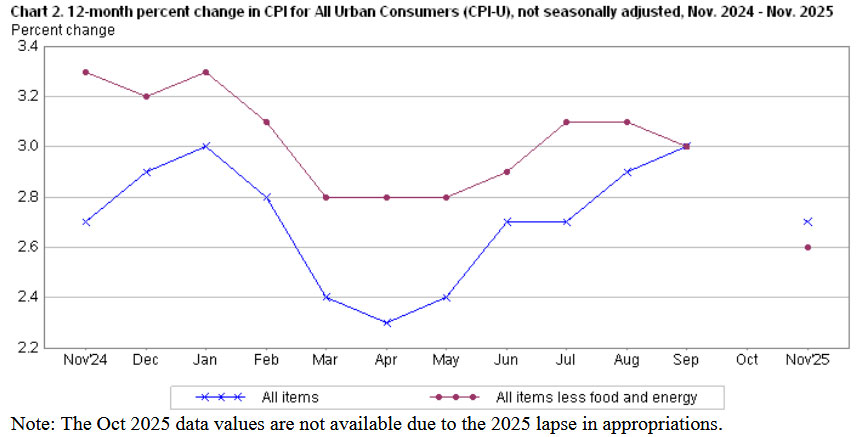
This November report from the BLS was massively slimmed down and in most cases the bureau did not report month-over-month price changes because it had no data for October. This is surreal. For example, here is the very strange chart of annual CPI rates over the last year:
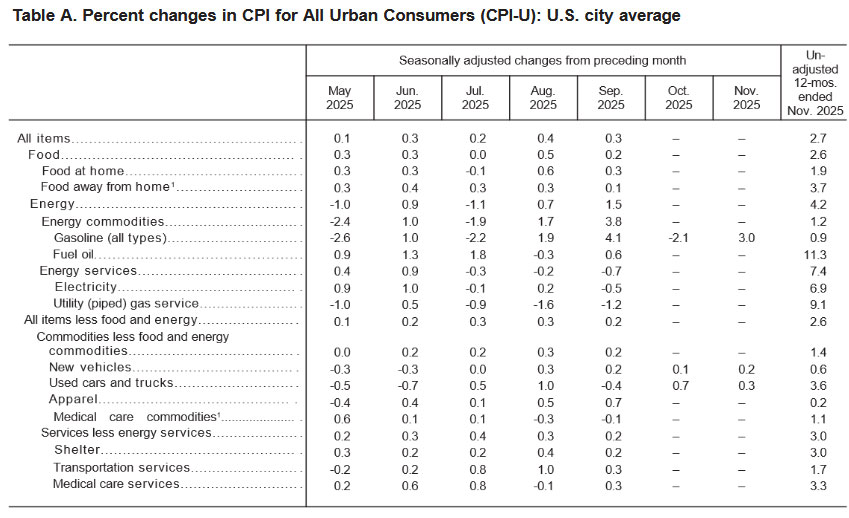
And here is the BLS’s slimmed-down list of month-over-month changes by category. There has never been an inflation report like this:
Honestly, I have nothing to say except: Let’s wait for December data, to be released on Jan. 13, hopefully on time.
What this means for TIPS and I Bonds
Investors in Treasury Inflation-Protected Securities and Series I Savings Bonds are also interested in non-seasonally adjusted inflation, which is used to adjust principal balances on TIPS and set future interest rates for I Bonds. Normally, this is a routine calculation, but not today.
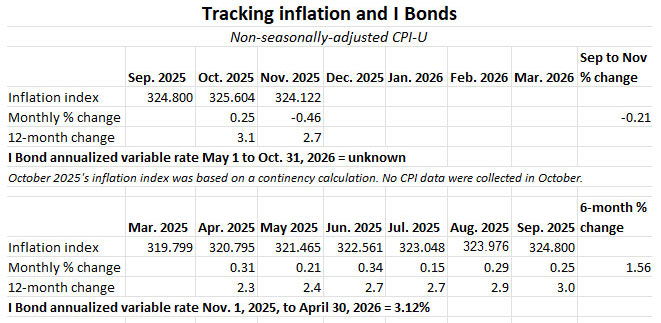
The Treasury was required by federal regulations to create a non-seasonally adjusted CPI index for October, which was used to set inflation accruals for TIPS in December. That October number — resulting from a synthetic calculation averaging inflation over the previous 12 months — was 325.604, which I had suspected was too high.
For November, the BLS set the inflation index at 324.122, a whopping 0.46% less than the October number. So yes, the October number was artificial, and artificially too high.
For TIPS. This November inflation report means that principal balances for all TIPS will fall 0.46% in January, after rising 0.25% in December, which was artificially too high. Here are the new January Inflation Indexes for all TIPS.
For I Bonds. The November report is the second of a six-month string that will set the I Bond’s new variable rate, to be reset on May 1, 2026. So far, two months in, inflation has declined 0.21%.
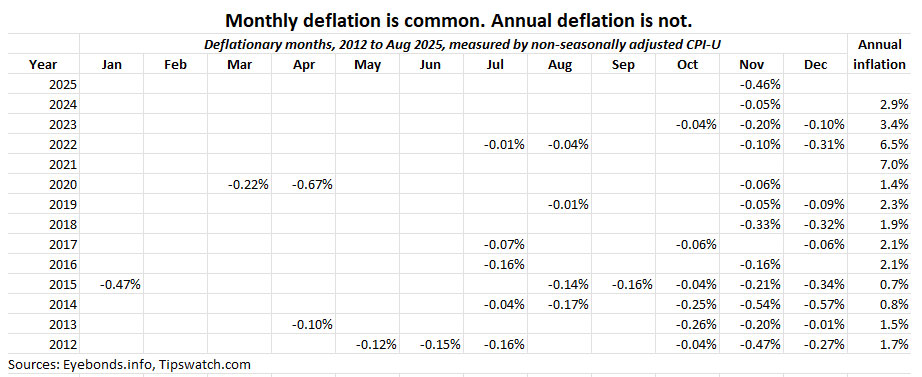
It is very common for non-seasonally adjusted CPI to dip into deflation in the last three months of the year, especially in November and December. This trend will turn around in the January to March inflation periods.
What this means for future interest rates
Because this inflation report was so convoluted, it is suspect. I do trust the BLS, but it has been working in a very difficult situation over recent months. The November data could open the way for future rate cuts by the Federal Reserve, but as Bloomberg noted in this morning’s report:
Given the data distortions, investors shouldn’t read too much into this one data print. …
It’s possible that this does reflect a genuine drop off in inflationary pressures, but such a sudden stop, particularly in the more-persistent services components like rent of shelter is very unusual, at least outside of a recession. The upshot is that is looks like we all have to wait until the December data is published next month to verify whether this is a statistical blip or a genuine disinflation.
Inflation analyst Michael Ashton posted a blistering critique of this inflation report this morning. Listen to it here:
Normally, we could look at month-to-month data on food prices, medical care services, apparel, electricity, etc., but all of that is missing in this pared-down November inflation report. My conclusion is that our confusion is justified.
—————————

Donate? This site is free and I plan to keep it that way. Some readers have suggested having a way to contribute. I would welcome donations. Any amount, or skip it, your choice. This is completely optional.
—————————
Follow Tipswatch on X for updates on daily Treasury auctions and real yield trends (when I am not traveling).
Feel free to post comments or questions below. If it is your first-ever comment, it will have to wait for moderation. After that, your comments will automatically appear. Please stay on topic and avoid political tirades. NOTE: Comment threads can only be three responses deep. If you see that you cannot respond, create a new comment and reference the topic.
David Enna is a financial journalist, not a financial adviser. He is not selling or profiting from any investment discussed. I Bonds and TIPS are not “get rich” investments; they are best used for capital preservation and inflation protection. They can be purchased through the Treasury or other providers without fees, commissions or carrying charges. Please do your own research before investing.

https://www.cnbc.com/2025/12/18/trust-these-numbers-economists-see-a-lot-of-flaws-in-delayed-cpi-report-showing-downward-inflation.html
“The BLS might have carried forward prices in some categories, effectively assuming 0% inflation…”
So the shutdown was just a convenient excuse to manipulate the data. That’s bad news for TIPS / I-bond investors and Social Security benefits recipients.
The problem for the BLS is that it needs to IMMEDIATELY reinforce its credibility, as investors fear manipulation. This inflation report didn’t help at all. I think the BLS is the mode of “If we don’t know, pick the smaller inflation number.”
David, you’re preaching to the choir…send a letter with your colleagues to the various agencies with a protest…i.e. quit just waiving y/our arms… You all have sent letters in the past…if the public won’t speak/walk who will? The agency employees? Good Luck on that
Hmm, so if one was convinced these numbers will have a future correction upward, undoing the TIPS principal balance drop in January, does that mean that January will be a rather good time to buy TIPS?
Because of the government shutdown, the Bureau of Labor Statistics (BLS) didn’t have new data, so they just “carried forward” (re-used) rent prices from April 2025.
Housing and rent make up about one-third of the total CPI. By pretending rent prices didn’t change for six months, the BLS is likely underestimating real CPI.
Here a section from the Bloomberg article CPI Report With Shutdown Voids Raises Doubts About US Inflation Data:
Stacey Standish, a spokesperson for BLS, said the agency used a process called carry-forward imputation for key housing price metrics. This method “imputes the price by using data from the last collected period, effectively proceeding as if the price had not changed,” she said. “Rents for October 2025 were carried forward from April 2025, yielding unchanged index values for rent and owners’ equivalent rent for October.”
I think the sum of October and November inflation is plausible. Note that all items inflation for the year ending November 2025 is the same as for the year ending November 2024 (Biden administration). All items less food and energy have been trending downward this year, as shown in your graph. Food and energy would have to be up substantially to counter the trend in core inflation. I’m not seeing it in energy, but am not paying much attention to food.
From 2002 to present, the average of October and November all items monthly inflation, not seasonally adjusted, has summed to -0.16%. This year, we got a sum of -0.21%, not wildly different from the normal end of year disinflation.
November looks like an outlier because it is correcting for the outlier/made up number we got for October.
FWIW, using the published Index Ratios, inflation rose 0.045% from 01 Nov 2025 (IR 323976) to 01 Feb 2026 (324122) – an annual rate of ~0.18%. I think David is correct, the data is messy and probably under-reports reality over that timeframe. The next CPI report in January may show inflation jumped up substantially (i.e. >5% annually) if BLS can get better data; if it does jump up, you can expect the Administration will be wailing about “false” news.
David,
I try not to engage in hyperbole, but I think you’re drastically underestimating how disastrous this report is. Sure, we understand the whole process was interfered with due to the government shutdown, it’s tough to get it “right” under these circumstances. But dig down into the reason(s) for the drop. The big culprit is the OER. The last point we got from surveys was a really weird one with a drop of 2%+ below anything we’ve seen since COVID (down to 1.6%) – it just didn’t fit with all the other data. But OK, there’s noise and every once in while it’s big.
But what did they do in this report? Filled it in with exact same strangely low value for each of the 2 missing months. No statistician trying to get “the best” estimate with limited data would use that value. They didn’t fit a trend, take a 3mo average or anything. They didn’t try to get it “right”. It’s a clear, intentional understatement of the best estimate for inflation.
So now we’ll wait and see whether they’ll get the data back on track. In my mind, we’ve likely got about 2% of “missing” OER inflation for 3 straight months (or 0.5% converted to full year). To correct that in a single month, we’d need to see a roughly 8.5% monthly, annualized OER print in the next report. If we don’t see that (and I expect we won’t) I think it’s the tipping point where the data can’t be fully trusted and that’s a huge issue for TIPS and I Bonds.
If Ashton is correct in suspecting inflation was under-reported here, TIPs and IBonds holders would be shortchanged (at least in the short run). Could you clarify whether this would be temporary or permanent? If it is the price level that it being directly measured, it seems any under-reporting should eventually correct as future measurements of the price level come in. But if the method is to measure month-over-month changes in inflation, and to determine the price level indirectly from that, any under-reporting in a single month would permanently get baked into the series. Any clarification on this? Thanks.
The “October hole” will take time to repair, maybe several months.
Too much speculation!
No one seems to have the requisite courage to do their “job.” Or there is no known ethical standards that are operative in town! Inflation is not going down but the presented numbers suggest otherwise…who outside of government has looked at the raw back-up data for this month AND, most importantly, for the phony one for last month that “seemingly” too high? And it reflects? Have a great Holiday!
”Honestly I have nothing to say…” said no blogger ever until now. 😂
I have a timely question. When the ACA subsidies expire at the end of the year, the cost of healthcare for over 22 million people will double or more. But in the inflation calculation, is it true that the increase in healthcare cost will exclude the out of pocket increase due to the expiration of the subsidies and only tally the increase in healthcare cost itself? And if so, does that mean inflation is under-counting real inflation on real people?
The CPI does not directly include the cost of health insurance, or home insurance.
Healthcare is one of the biggest drivers of inflation. The fact that it is excluded from CPI just shows why folks feel affordability is a huge problem. Then on top of that add the expiration of ACA subsidies for 22 million Americans doubling or tripling the monthly premiums from there and it’s a full blown crisis.
Healthcare is included in the CPI but not health insurance premiums.
And the ACA subsidies aka Premium Tax Credits that were originally part of the ACA are not expiring.
Only the enhanced PTCs that were passed in the ARPA and extended in the IRA are expiring at the end of this year. Both of those acts were written and passed with the intention of them expiring.
Good point. I will also mention that the Trump tax cuts were also written with the intention of expiring this year, but then became a “major disaster” if they expired, so the GOP extended them. The same will happen in a few years with no tax on TIPS, no tax on overtime, higher senior deduction, etc. The ACA subsidies fall into this pattern. The expirations for all of these are a budget ploy, to make future deficits look smaller. Politics, however, means they won’t expire and the deficit will continue to climb.
Interesting. I agree, David, that December data will be key. For what it’s worth, I posted the following on Tipswatch on June 11, 2025 in response to another commenter. Feeling pretty good about my analysis!
————————————————
“You might be proven correct in your assessment of tariffs. But perhaps not. A couple of points:
Ultimately, the impact will show up in the data, right? So if inflation spikes this year and the U.S. goes into a recession in the second half of the year, I’ll realize that my analysis of what would happen was, as it turned out, incorrect. And if inflation remains muted and the U.S. economy grows 2%-3%, you’ll realize the same, I would expect.
You say “GDP was 2.4% in the 4th Quarter of 2024 before tariffs. GDP was -0.3% in the 1st Quarter of 2025.” But the 1st Quarter of 2025 was ALSO before tariffs. Put another way, the last two quarters before tariffs averaged a tick over 1% annualized GDP growth. Q2 2025 looks better.
I agree that the costs of tariffs are passed on IN PART to U.S. consumers (similar to how New Jersey residents certainly pay tolls and Florida residents certainly pay sales tax). The negative impact of tariffs on U.S. consumers depends on how much of the tariffs are passed on. The data from the tariff increases on China in the last Trump administration (which tariffs were maintained by the Biden administration) seemed to show that less than half of the cost of those tariffs were passed on to consumers. This time might be different.”
Worth reminding people: Trump fired the BLS head back in August over disappointing data that made him look bad. Any rosy report from BLS is suspect because it is produced by people who know Trump can fire them if the numbers—even if accurate and truthful—make him look bad.
Sure, there could be some lingering influence, but not massive. There is no political appointee running the BLS. The acting commissioner, William Wiatrowski, is a long-time government statistician in both Democratic and Republican administrations. (He should get the permanent job, in my opinion.) My belief is that BLS people would rather quit than lie about inflation.
David, with all due respect, facts are better, e.g “but not massive.” Really! Don’t have to be a political appointee…look at the thousands that lost their jobs w/o any reason. Fact based analysis is nicer! All proposed appointees have a little loyalty quiz to pass…do you think your candidate could or would?
Have a great Holiday
If deflation in the Fall is common, why is this drop surprising?
Deflation in non-seasonally adjusted inflation is common in November and December, but a drop of 0.46% at a time when inflation was generally running hot is very surprising. Could be we really have turned a corner on prices, or it could be the data are a mess.
The data is a mess. And may God help the people who make it right.
I had a high school physics teacher who would give out “Betty Crocker Awards” for students who fudged the data in an experiment. I think we have a winner, winner.
Jim I was Retired
>