
By David Enna, Tipswatch.com
Since there were very few month-to-month price changes detailed in the November inflation report, we are all left wondering about key areas that resulted in surprisingly low inflation for the September to November period.
This CPI report by the Bureau of Labor Statistics has been highly criticized by economists and inflation experts. Headline and core inflation numbers rose by less than half the number predicted by experts, with all-items CPI rising 2.7% over the 12 months to November, and core up 2.6%.
The BLS produced little data on overall month-to-month inflation changes, but reported that CPI was up only 0.2% total in the two months of October and November. At a time when annual inflation was running at 3.0%, this appears to be cutting the inflation rate by more than half from an expected monthly rate of 0.25%.
However, a decline from 3.0% all-items inflation in September to 2.7% in November is not unusual. And in fact over the last 10 years, annual inflation rates have fallen half the time in that September to November period.

There has been widespread skepticism (including strongly from Tipswatch readers) about the validity of the November inflation report. From Bloomberg’s report:
In a report fouled by the record-long government shutdown, inflation in several categories that had long been stubborn seemed to nearly evaporate. Chief among those were shelter costs, which make up about a third of the consumer price index, but other categories like airfares and apparel notably declined. …
Stacey Standish, a spokesperson for BLS, said the agency used a process called carry-forward imputation for key housing price metrics. This method “imputes the price by using data from the last collected period, effectively proceeding as if the price had not changed,” she said. “Rents for October 2025 were carried forward from April 2025, yielding unchanged index values for rent and owners’ equivalent rent for October.”
OK, I am confused. Carry forward rent data from April 2025? Leading to zero increase in shelter costs in October? Can someone help me understand? From a Fortune report:
“This is a wacky number,” Diane Swonk, chief economist at KPMG, told Fortune. “Shelter costs basically flatlined October by carrying forward September. When housing is that large a component, that really matters.”
Housing appears to be the most distorted category. Shelter accounts for more than 40% of core CPI, yet the November report implies rents and owners’ equivalent rent was essentially zero in October.
“We expected it to cool,” Swonk said, “For this low level, it seems a little bit too much.”
She warned those assumptions don’t simply affect one month’s data. “Because of the assumptions that were made in October, it literally anchors the index going forward,” she said. “It lingers.”
More from Barron’s:
Cris de Ritis, deputy chief economist at Moody’s Analytics, said it’s best not to draw too much signal from the latest shelter data. He notes that market data on apartment rents have been weak, making the downward trend plausible. “It’s the magnitude we’ll want to examine with some caution,” de Ritis said.
“The CPI report definitely comes with an asterisk this month, given the carry-forward assumptions the BLS had to make,” de Ritis said. “It’s not unprecedented for disinflation to occur over a 2-month stretch in the history of the series, but it has been rare.”
Because we got no month-to-month data for October and November, I decided to look at look at changes in September to November annual price increases for major consumer categories. It’s about the only indication we have to determine — in theory — where inflation is declining or rising.
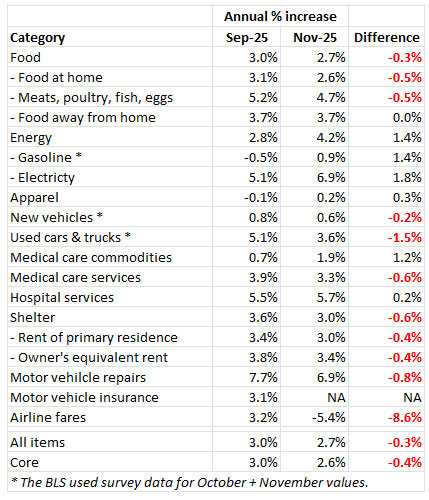
This chart suggest a strong trend of disinflation in the U.S. economy, with most areas outside of energy seeing declines in annual inflation rates. The decline in shelter to 3.0% was a huge factor in both the all-items and core inflation declines.
In an FAQ on its processes for this inflation report, the BLS gave a very foggy update on shelter calculations:
BLS calculates rent and owners’ equivalent rent using six-month panel collection. How will the missing October 2025 data impact the April 2026 rent and OER indexes?
BLS is researching how the missing October 2025 data for rent and OER will affect the 6-month change for April 2026 data.
One of the unique issues created by the government shutdown is that October inflation numbers simply don’t exist. For example, the BLS noted:
For some programs, products with missing data may be curtailed. For example, the CPI latest numbers page will be temporarily disabled, and the CPI inflation calculator will not calculate output using October 2025 data. … In the BLS Public Data API and the database, a dash will represent a missing data value, and associated net and percent changes will not be visible.
The end result, possibly, is that we will see lower annual inflation numbers going forward at least for several months, even if the monthly data are accurate. It will take some time to recover from “theoretical” 0.1% inflation for both October and November.
I have noted that I don’t believe that the BLS set out to please the White House by publishing low inflation numbers. But I do believe these statisticians now have reason to guess on the low side when they are estimating inflation, and this November report was full of guesses.
See: U.S. annual inflation falls to 2.7% for November, a surprising drop
—————————

Donate? This site is free and I plan to keep it that way. Some readers have suggested having a way to contribute. I would welcome donations. Any amount, or skip it, your choice. This is completely optional.
—————————
Follow Tipswatch on X for updates on daily Treasury auctions and real yield trends (when I am not traveling).
Feel free to post comments or questions below. If it is your first-ever comment, it will have to wait for moderation. After that, your comments will automatically appear. Please stay on topic and avoid political tirades. NOTE: Comment threads can only be three responses deep. If you see that you cannot respond, create a new comment and reference the topic.
David Enna is a financial journalist, not a financial adviser. He is not selling or profiting from any investment discussed. I Bonds and TIPS are not “get rich” investments; they are best used for capital preservation and inflation protection. They can be purchased through the Treasury or other providers without fees, commissions or carrying charges. Please do your own research before investing.

None of this should be surprising. Inflation is a monetary phenomenon and M2 has largely been under control since late in the Biden administration. Inflation has been relative tame since then, though housing has been a lagging indicator but has been stabilizing of late.
Tariffs don’t drive inflation, but can reallocate where the existing money supply goes, raising some prices and reducing others.
These are good points, and one reason many economists do expect tariffs to have only a one-off hit on inflation (if they every stabilize). M2 is likely to start rising in 2026, however, when very large tax refund checks start getting mailed out and W2 withholding gets adjusted downward for the effect of no tax on tips and overtime.
I still use TIPS and I bonds for income purposes, but you have to really have your head in the sand to believe they accurately measure and compensate for inflation.
Look at the recent action in the gold and silver markets, to see what the true inflation is.
If the price of gold and silver were somehow correlated with our US dollars then something would seem to be way askew these days.
Do you think this missing data may cause the next I bond variable rate setting May 1st to be lower than it should be?
It could have an effect, but I’d guess things should even out over the next few months. If there is no resolution of the shelter issue, it will keep overall inflation a bit unrealistically lower.
We are apparently living in one of the best of times according to all government reports on inflation, unemployment, wage growth, and the stock market is booming. Who is complaining?
My Dad thought the best times were the early 90s…what did he know? The best of time “for him” was what he thought! With a fraud in DC these are not the best of times…if you think so, congrats!
I think that was sarcasm.
Today’s 2-year UST note auction cleared at a yield of 3.499%. CNBC is quoting 3.507%. So why is the U.S. Treasury showing today’s closing yield at 3.44%? Are they trying to present to the public a yield lower than reality? I question this government’s every motive and I’m highly skeptical of any data it releases.
https://home.treasury.gov/resource-center/data-chart-center/interest-rates/TextView?type=daily_treasury_yield_curve&field_tdr_date_value=202512
The auction did result in a high yield of 3.499%. US Treasury’s closing yield was an estimate, and hours later.
A 6 bps difference intra-day? I don’t think so. And CNBC is quoting a yield consistent with the auction clearing yield. That’s the best “estimate” Treasury can make? Come on.
These estimates are often a bit off. The auction result is the real thing.
The main point is that the day-end Treasury estimates are an excellent way to follow trends over time, and a “decent” predictor of current market yields, but not a sure thing. Of all the statistical things to worry about, these Treasury estimates are an off-the-chart low concern.
And Bloomberg is also quoting 3.51%.
Everybody at Treasury has a Bloomberg terminal. There’s no reason for such a large discrepancy.
Most alleged conspiracies are really just a misunderstanding of what one is looking at.
You are comparing apples to oranges. Your link is to the Daily Treasury Par Yield Curve Rates which are NOT the same as the rates quoted by the financial press. The Par Yield Curve Rates are derived using a monotone convex method. Inputs are indicative, bid-side market price quotations (not actual transactions) for the most recently auctioned securities obtained by the Federal Reserve Bank of New York at or near 3:30 PM each trading day. The input prices are converted to yields and used to bootstrap the instantaneous forward rates at the input maturity points so that these instruments are sequentially priced without error. The initial step is followed by a monotone convex interpolation performed on forward rates midway between the input points to construct the entire interest rate curve. This fitting minimizes the price error on the initial price input points, resulting in true par rates.
More details on how Par Yields are computed can be found at this link
https://home.treasury.gov/policy-issues/financing-the-government/interest-rate-statistics/treasury-yield-curve-methodology
Now that’s a lot to unpack, but for the sake of this conversation, it isn’t just looking at the price from some brokerage house on a bond with a maturity date that is close to two years from now. For example, today CNBC is using the two-year with a 12/31/2027 maturity date. The Treasury’s Par Yield Curves provide Constant Maturity Treasury rates are read from fixed, constant maturity points on the yield curve and thus won’t match the exact yield on any one specific security.
A 6 basis point discrepancy is highly suspect, especially when an auction established intrinsic value that very same day. Treasury (and BLS) can publish anything they want and the public has no way of knowing whether the data is wrong or being manipulated. Reagan famously said “trust but verify”. We have no way of verifying what’s being published and many of us have zero trust in our institutions.
“A 6 basis point discrepancy is highly suspect”
Not on two different measurements. And that is my point. You are freaking out because the auction yield on a 2-year bond that will be issued on 12/31/2025 doesn’t match the Constant Maturity Treasury rate as computed by the Treasury’s Par Yield Curves for 12/22/2025. They are not the same thing and there is no reason to expect them to be the same value. Anyone who understands what the Par Yield Curves are can replicate them. Anyone who doesn’t understand what the Par Yield Curvers are will just get confused.
The issue date of 12/31/25 seems irrelevant to me given that the quotes from Bloomberg and CNBC were consistent (within 1 bps) with the auction yield when Treasury reported that the yield was 6 bps lower. The UST market (especially the short-end of the curve) is one of the most liquid asset markets in the world. The discrepancy is not justified. And if it’s some academic exercise that no one lacking a PhD in math can make sense of, why publish this data at all? It can only create mistrust & suspicion, especially when this President spends seemingly every waking moment spouting off how interest rates should be lower.
You are missing the entire problem with your analysis.
Bloomberg and CNBC are reporting the yield on a 2-year bond that will be issued on 12/31/2025 and pay off on 12/31/27.
The Constant Maturity Treasury rate as computed by the Treasury’s Par Yield Curves for 12/22/2025 is the yield on a hypothetical 2-year bond that would pay off on 12/22/2027.
These are two different values.
What does Bloomberg/CNBC quote on a day the security is not being auctioned by Treasury?
CNBC isn’t very clear about how they choose what they quote. However, you can determine what they are quoting. Today they are quoting the 2-year treasury that matures on 12/31/2027 according to the information on this page.
https://www.cnbc.com/quotes/US2Y
At least at Bloomberg, they switch very quickly to the new issue, and you can spot the new coupon rate. This doesn’t apply to the December TIPS auction, a reopening, but could be seen in the new 2-year nominal.
Good to know. Just as I suspected. Bloomberg, just like CNBC, is not displaying the Constant Maturity Treasury rate as computed by the Treasury’s Par Yield Curves. No one should expect the values from Bloomberg or CNBC to match the CMT rates.
I’ve completely lost faith and confidence in our institutions. If you need a hedge against inflation, TIPS and I-bonds are no longer viable. Look elsewhere.
That was one of the goals of this administration, to undermine the public’s faith in our institutions for a whole host of reasons — to make people question the validity of our elections (because someone lost one), our judicial system (because someone was indicted on dozens of felony charges and convicted of dozens more), our economic data (because someone doesn’t like data that is unfavorable), our polling organizations (because someone doesn’t like the polling results), and the media (because someone doesn’t want to face criticism, difficult questions, and be exposed for selfish motivations and incompetent governance). I see it is working. And also, here aren’t many financial instruments that protect against inflation so there aren’t many places to turn if TIPS and I Bonds aren’t a viable option any more,
Have you seen the price of gold lately?
Yes, but is it too late?
I haven’t had faith in the CPI, or elections, or any other government report for many years. The CPI adds in luxury items that many lower income people can’t afford. For a person just making it, living paycheck to paycheck, the CPI is higher than the reported number. The unemployment numbers aren’t close to accurate either. If you want to see something remotely close look at the U6 numbers. For elections, well these are some of the most powerful positions in the world. Why wouldn’t people cheat if they can get away with it? People cheat for a lot less. Considering all of that, I still think TIPS are a good deal. They may be off when compared to the true CPI but they are the best thing we currently have. Gold may track inflation over the long term but it’s prone to bubbles like now.
I have worked elections as an assistant judge since 2016 and I have a strong belief in the system. There is no widespread cheating going on … at the polls. Gerrymandering is another issue, though.
A couple of months ago I was thinking about investing in copper. Now copper is soaring. But the only investment that seemed feasible to me was an ETF with a firm that I wasn’t sure about and my custodian would have classified me as an aggressive investor.
Single-commodity investments are risky, but honestly it’s not my style and I don’t know anything about them.
I wasn’t going to be a huge investment. I had read some articles on copper and many were saying that copper was undervalued and it made enough sense to me to take some risk.
I was more concerned about the firm and how it would affect my overall portfolio.
Can this one report cause the future returns for people holding TIPS and I bonds to be artificially lower, or will the differences caused by this one report be washed away once more months are added into the mix?
In partial answer to your question, assume that the May CPI report (which will have the updated rental data) fixes all of the “errors” in the December 2025 report. On that assumption, the 5/31/26 principal value of every TIPS Note should be the same as it would have been if October, 2025 CPI report had been timely issued and the”errors” in the December 2025 report had not occurred.
However, because of the “errors” in the December 2025 report, it is likely that any TIPS interest payments made between the December 2025 and the May 2026 CPI reports will have been too low by some amount. That loss (though probably small) will never be recovered.
Also, while the cumulative amount of the CPI-based principal adjustments on all TIPS will have been “made right” by adjustments pursuant to the May 2026 CPI report, the monthly accrual of those adjustments will probably have been permanently affected. In other words, the (taxable) principal adjustments through 12/31/25 will probably have been understated by some amount, but any such understatement will have been restored by an exactly offsetting overstatement of the (taxable) principal adjustments between January and May, 2026.
It’s only going to get worse from here. Elevated inflation is now regarded as an “inconvenience,” and if government shutdowns are required to provide a palatable excuse for no data, followed by whispers in the wind as substitute source, so be it. I suspect there will be as many shutdowns in the next three years as are necessary to fulfill a non-turbulent journey to destination. Please remember to buckle up whenever you are seated, and keep a hand on your wallet at all times. Thank you for your attention to this matter!
I’m not inclined to push back against those who have lost some trust in government. No way. This year has been unbelievable on that level.
However, crude oil and gasoline are down double-digit percentages in 2025, and near 5-year lows. That’s a legitimate factor in a potential disinflation story.
And housing is always able to spark debate. Everyone has an anecdote. There’s AI contributing to job reductions and ICE tactics contributing to reduced immigration and tourism. Some cities are more impacted than others, but it’s not hard to assemble a case for rents declining. Local landlords seem to be offering multiple weeks free.
You start to see how government can cause inflation, but they are multitaskers: and they can also cause recession.
David, and now, you and your colleagues have a basis for a letter putting a line in the (constantly) moving sand/landscape. Thanks for staying on top of this.
Even with the current .9% fixed component for ibonds through the May reset, the reliability of the inflation component for any new purchases now (coupled with a required minimum 6 month May rate) is a sham for seniors! And a shame on the BLS survivors! I can fix my dog easier!
And, a constant advisory/update for your readers on expected/estimated fixed component for ibond rates for May reset will be really welcomed!
If you know that you will be fired because the boss doesn’t want accurate data, then you will not produce accurate data. As they say in my old CPA profession, figures don’t lie, but liars figure.
Here’s how I understand what the BLS is up to.
The CPI Housing Survey collects price observations of rental housing units in urban areas across the United States. The country is divided up into sample units which are future divided into 6 units called panels. The CPI program then collects rent data from each panel every 6 months since many rents change infrequently, being locked in place for a given lease term, and collecting rent data less frequently allows for a larger sample. Most rents included in the sample are continuing rents, and only a minority of observations are rents which have changed since the previous observation period. The rents for panel 1 are collected in January and July; panel 2, in February and August, etc. Panel 4 rents are collected in April and October … except this year they were not collected this October, so BLS just used the same values from April. Those April 2025 values will remain in the computation until April 2026 when panel 4 rents will be collected again.
for lots more details follow the link
https://www.bls.gov/cpi/factsheets/owners-equivalent-rent-and-rent.htm
Jim, this is stellar information, thank you. This means, I think, that the overall values from April did not determine the October 2025 shelter number. But because there were no new data from Panel 4 — the only new data the BLS was going to get — the September overall shelter index was carried forward with zero increase. That won’t continue into December, but unless those panel 4 numbers are updated, shelter inflation will continue to be under-reported, by a bit, through April 2026. (Unless BLS fixes this.)
I agree with your assessment of the impact of this data error.
Stated another way then, 5 parts in 6 of the rent data are as up-to-date in the November report as they ever are.
I would say it is a default. Holders are now deprived of an accurate determination of the principal of their bond and the interest that accrues on that principal. Yes CPI has problems, we all signed on knowing there were quirks in the calculation, but this is a failure to perform the government’s side of the deal. And even if you think this will be ironed out in time, the agreed principal amount today for someone needing to sell is unknown. If Treasury had declared that they could not process a payment on a regular bond because of the shut down and would get around to it later, it would have been a default. I don’t see a difference when they fail to gather data and make a calculation that impacts the principal amount of a bond in a timely manner. And if we suspect that there is ill intent or even just a predisposition to go low on the numbers it is even worse. I won’t sell out on this, but have to seriously reconsider allocating to new TIPS without something much more than is currently offered by the market as the spread over “guesstimatedinflation.”
Scary that our country’s economic decisions are based on sketchy data, at best.
When one mentions trend, one thinks of technical analysis. I do not see the downtrend.