
Of course, this forecast, and every other one you read, may be wrong.

By David Enna, Tipswatch.com
It’s July, and that means it is time for my annual adventure trying to forecast next year’s Social Security cost-of-living adjustment. I’m usually fairly accurate, but rarely 100% correct.
Last year, on July 28, I predicted the COLA would come in at 2.7%. Instead it was 2.5%. In 2023, I projected a range of 3.0% to 3.2%, and the result was 3.2%. You get the picture. This is not an exact science. But it is important to understand the needlessly complex way the COLA is calculated, which is rarely explained in mainstream media.
- The index. The Social Security Administration does not use the standard measure of inflation that you see reported each month. Instead it uses CPI-W, the Consumer Price Index for Urban Wage Earners and Clerical Workers, which often runs slightly lower than the standard CPI-U. See this.
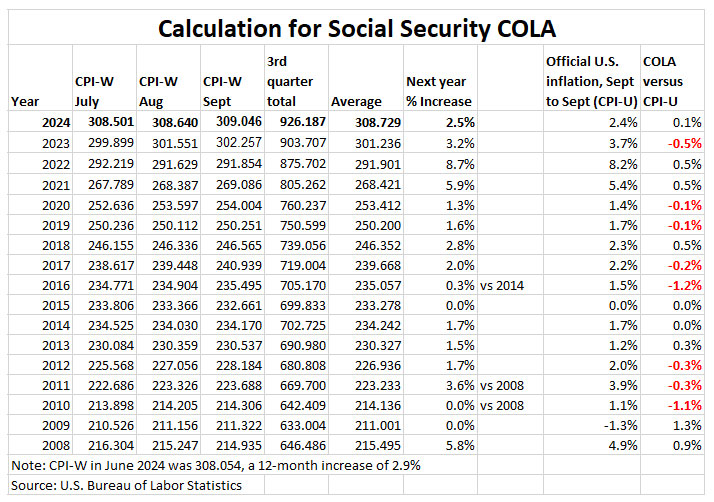
- The time period. Instead of using a specific annual rate of inflation, the SSA looks at an average of CPI-W indexes for three months, July to September, and compares that to the average from a year earlier. In 2024, for example, the three-month average was 308.729, an increase of 2.5% over the average for 2023. So the COLA for 2025 was set at 2.5%.
- The summer months. Inflation can be notoriously volatile in the months of July to September. We could easily see a month of high-ish inflation, or a month of deflation. That means any Social Security COLA projection — including mine — is just an educated guess.
The June inflation report, released this week, set the baseline for this COLA calculation. For June, the BLS set the CPI-W index at 315.945, an increase of 2.6% over the last year. So does that mean the Social Security COLA will end up being 2.6%? No, that is the baseline, but the actual COLA calculation will be based on the average of CPI-W indexes for July to September.
In this chart, I have provided five potential monthly inflation scenarios for the July to September period — 0.0% per month to 0.4% per month — and then calculated the effect on the eventual Social Security COLA.
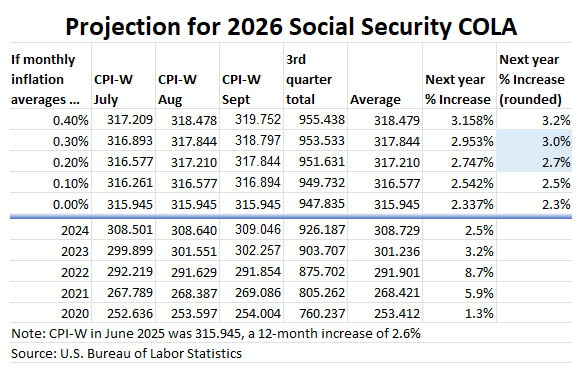
Most likely, none of these scenarios will end up being accurate. Anything can happen, including a bout of deflation. But I think the scenario with the highest probability is inflation averaging close to 0.3% a month over the three months, resulting in a Social Security COLA in the range of 2.8% to 3.0%. So in my headline I said “around 2.8%.”
That’s a conservative estimate (the COLA could be higher). This is a risky prediction because inflation often flops around in the summer months — some months higher, some months lower. But 2025 is an unusual year, because 1) the inflationary effect of U.S. tariffs is starting to be felt across the economy, and 2) the baseline inflation numbers for 2024 were quite low, making a higher increase this year more likely.
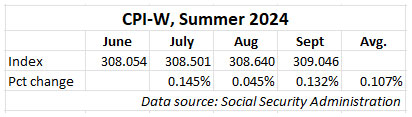
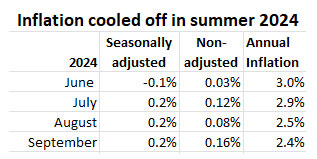
No summer month in 2024 recorded an inflation rate of 0.2%, and in fact in August CPI-W inflation was very close to zero. I based my projection last year (conservatively, I must say) at 0.2% a month. That is why my prediction was too high.
According to the SSA, the average Social Security benefit payment for retired workers in June 2025 was $1,952. Increase that amount by 2.8% and you get a monthly payment of $2007, an increase of about $55 a month.
What others are saying
Everything I wrote up to this point was done before checking any other forecasts (my annual tradition). So let’s now see what others are predicting:
This is from Money.com:
New estimates released Tuesday from both The Senior Citizens League, or TSCL, and independent Social Security and Medicare policy analyst Mary Johnson put the upcoming COLA between 2.6% and 2.7%, based on inflation data through June.
The Senior Citizens League puts a lot of research behind its forecast, so it has credibility. Its prediction is lower than mine, so there you go. I would tend to lean on the higher side this year. (Last year, the League predicted an increase of 2.6%, better than my prediction of 2.7%.)
Rising Medicare costs
And now the bad news … Medicare Part B monthly premiums are automatically deducted from Social Security for most enrollees. Medicare is predicting that the standard Part B premium will increase from $185 to $206.50 in 2026. That’s an 11.6% jump, much higher than the likely increase in the Social Security COLA.
The same thing happened this year, when the COLA increased 3.2% but Part B costs increased about 6%. See more on this topic. The net effect is that retiree benefits will be falling behind inflation. But some of that pain will be eased by the new $6,000 boost in the standard deduction for many people over 65.
SSA COLA versus CPI
The combination of using CPI-W and the smoothing effect of a three-month average often results in the Social Security COLA being lower than annual CPI. The Senior Citizens League has lobbied for years to replace CPI-W with CPI-E, an index that more accurately reflects costs faced by older Americans.
However, for benefits in 2025 the COLA was 2.5%, slightly surpassing CPI-U at 2.4%. The reverse could happen this year, even if the COLA reaches 2.8%.
Also see: Medicare costs for 2024 are rising faster than U.S. inflation
— Does The Social Security COLA Shortchange Seniors?
—————————

Donate? This site is free and I plan to keep it that way. Some readers have suggested having a way to contribute. I would welcome donations. Any amount, or skip it, your choice. This is completely optional.
—————————
Follow Tipswatch on X for updates on daily Treasury auctions and real yield trends (when I am not traveling).
Feel free to post comments or questions below. If it is your first-ever comment, it will have to wait for moderation. After that, your comments will automatically appear. Please stay on topic and avoid political tirades. NOTE: Comment threads can only be three responses deep. If you see that you cannot respond, create a new comment and reference the topic.
David Enna is a financial journalist, not a financial adviser. He is not selling or profiting from any investment discussed. I Bonds and TIPS are not “get rich” investments; they are best used for capital preservation and inflation protection. They can be purchased through the Treasury or other providers without fees, commissions or carrying charges. Please do your own research before investing.


I’d wait until October to make a decision. The difference between keeping the cash in a 3% HYSA and buying…