I Bond confusion: Understanding how the 0.0% rate rolls out

Back on May 1, I wrote an article about how the new  I Bond inflation adjusted variable rate had fallen into the deep negative, -1.60% (annualized). And this meant any Series I Savings Bond with a fixed rate of  1.6% or less would pay 0.0% for six months.

Since then several readers have commented that they aren’t seeing the 0.0% rate in the Savings Bond Wizard. Others have cursed me and told me I have it all wrong, believing that the fixed rate is ‘fixed’ and can never be reduced. Others are just confused.

If you use the Treasury’s Savings Bond Wizard, you are going to see some misleading numbers for awhile, but they aren’t wrong. (I love the Wizard, by the way, it is an excellent tool.) If you have it, open it up today and get the latest update, which provides interest rates through November 2015.

But first, read this …

How is that rate calculated? The Treasury Direct site has a lot of great information on I Bonds, including a very good Rates & Terms page. This chart showing the I Bond rate formula is drawn from that page:

I Bond formulaOK, it’s obvious if the fixed rate is 0.0% and the inflation rate is negative, the composite rate is going to drop to 0.0%, the lowest possible. But what if your fixed rate is 3.0%, as it was back in the good old days (May to November 2001)? What will happen to your fixed rate under that formula? Here is the calculation:

[0.0300 + (2 x -0.0080) + (0.0300 x -0.0080)]
[0.0300 + -0.0160 + – 0.00024]
0.01376
resulting in a composite rate of 1.38%

So, according to the Treasury formula, your fixed rate will be lowered by the negative inflation rate. It will result in a composite rate of 1.38% for six months.

But … my Savings Bond Wizard shows a higher rate! It might, and it isn’t wrong. The I Bond composite rate rolls out across six months, depending on the month when you first bought the I Bond. The Treasury has another nice chart that shows this:

I Bond rate rolloutSo the Savings Bond Wizard will continue to show a higher rate, based on the last period’s 1.48% variable rate, until the new rate kicks in – depending on the month when you first bought the I Bond. If you bought an I Bond in October 2003, the new rate will begin in October 2015 and continue for six months. If you bought in November 2003, the new rate started May 1 and will continue for six months.

I have updated my Savings Bond Wizard and here is what is it showing for May 2015 and November 2015 for the I Bonds I currently own:

May November

FYI: Rate is the current six-month composite rate, yield is the annualized yield over the lifetime of the I Bond.

That is almost crystal clear, isn’t it? As the new composite rate rolls out over the next six months, all my I Bonds will be affected by the -1.6% variable rate, and the yield – the annualized interest paid over the life of the I Bond – will also decline.

Take a look at the two I Bonds issued in October 2001. They have a fixed rate of 3.0% (nice!) and so they fit the formula that I posted above:

[0.0300 + (2 x -0.0080) + (0.0300 x -0.0080)]
[0.0300 + -0.0160 + – 0.00024]
0.01376
resulting in a composite rate of 1.38%

If you look at the November 2015 rate, it is 1.38%.

And another thing. I am totally, 100% recommending hanging on to all your I Bonds through this six months of reduced returns. Inflation fell at an annual rate of -1.60% from September 2014 to March 2015. Even if you are getting a return of 0.0%, you are beating inflation by 1.6%. You’ll survive.

Because you can buy only $10,000 per person in I Bonds each calendar year (plus the IRS refund trick), they are an asset to hold. I Bonds are part of a strategy of pushing inflation-protected, tax-deferred money into the future. The only reason to sell them is if you need the cash right now.

I hope this helps clear up some of the confusion circling around I Bonds in these strange months of post-deflation 2015.

Posted in Investing in TIPS | 11 Comments

U.S. inflation remains muted, increasing 0.1% in April

The Consumer Price Index for All Urban Consumers (CPI-U) increased 0.1% in April on a seasonally adjusted basis, the U.S. Bureau of Labor Statistics reported today. Over the last 12 months, inflation declined 0.2%.

Falling energy prices were a key factor in April’s mild inflation. Gasoline prices, for example, fell -1.7% after rising in the two previous months. Gas prices are down -31.7% over the last 12 months. Fuel oil prices were down a very strong -8.4% in April, the BLS reported. Balancing off those declines were increases in medical care services (0.9%), shelter (0.3%) and used cars and trucks (0.6%). Overall food prices were unchanged in April.

Core inflation – which strips out energy and food – was up 0.3%, its largest increase since January 2013. Core inflation is up 1.8% over the last 12 months.

Holders of TIPS and I Bonds are also interested in non-seasonally adjusted inflation, which is used to determine the principal adjustments for TIPS and future interest rates for I Bonds. In April, the inflation index rose 0.2% to 236.599, but over the last 12 months inflation was negative at -0.2%.

I have updated my Tracking Inflation and I Bonds page to reflect these new numbers.

Although overall inflation remains very muted, April’s core inflation number could give the Federal Reserve something to ponder. The Fed adopted a 2% inflation target in April 2012. Core inflation of 1.8% is approaching that number, but I still can’t see the Fed acting to raise short-term interest rates in the near term.

Here is the inflation trend for the last 12 months:

inflation trend

Posted in Investing in TIPS | 2 Comments

10-year TIPS reopening auctions with a real yield of 0.358%

The US Treasury just announced that its reopening of a 10-year TIPS – CUSIP 912828H45 – auctioned with a real yield (above inflation) of 0.358%. This is a 9-year, 8-moth Treasury Inflation-Protected Security with a coupon rate of 0.250%.

Because the auctioned yield ended up higher than the coupon rate, buyers got this TIPS at a discount – an adjusted price of about $98.62 per $100 of value. The discount was a little greater because this TIPS has an inflation index of 0.99633, meaning it remains slightly below par value after several months of deflation. So technically buyers are paying $98.62 for $99.63 of value as of May 29, the issue date.

Inflation breakeven rate. Comparing the yield of 0.358% with the current yield on a 10-year nominal Treasury (2.21%), we get a 10-year inflation breakeven rate of 1.852%. This means that if inflation average higher than 1.852% over the next 10 years, this TIPS will outperform a nominal Treasury. This is a historically low number, but reflects the muted level of inflation over recent years.

Six months ago, a similar TIPS reopening resulted in a real yield to maturity of 0.497% and a very similar inflation breakeven rate of 1.853%. This indicates that TIPS yields are tracking closely with those of traditional Treasurys.

Reaction to the auction. In the minutes after the auction, the TIP ETF, which holds a broad range of maturities, had minimal reaction. TIPS had been trading slightly higher all morning, indicating that yields were trending slightly down.

Bloomberg’s Alexandra Scaggs noted that the auction “attracted the lowest demand since September 2014.”

“We’re just simply not too wrought up about inflation expectations at the moment,” said Jim Vogel, interest-rate strategist with FTN Financial in Memphis, Tennessee. …

’’There was some concern that the market was beginning to doubt the Fed’s ability to get inflation back up, but that fear has dissipated a little bit,’’ said Joshua Feinman, New York-based global chief economist with Deutsche Bank Asset & Wealth Management, which oversees $1.3 trillion. But now, “most of the impact has already been priced into the market.”

Posted in Investing in TIPS | 1 Comment

Checking in on today’s 10-year TIPS reopening

Treasury logoNoncompetitive bids close at noon for CUSIP 912828H45, a 9-year, 8-month Treasury Inflation-Protected Security with a coupon rate of 0.210%. Competitive bids close at 1 p.m. when the auction ends. Here’s what we can say at 10:06 a.m.:

  • Bloomberg’s Current Yields page shows this TIPS trading this morning with a real yield (after inflation) of 0.34% and a price of about $99.15 per $100 of value. This TIPS will go at a discount because its yield is higher than the coupon rate.
  • The Wall Street Journal’s Closing Prices page shows this TIPS – which matures in January 2025 – closed Wednesday with a yield of 0.336% and a price right around $99.19.
  • The US Treasury’s Real Yields Curve page estimates that a full-term 10-year TIPS closed Wednesday with a yield of 0.38%
  • Finally, the TIP ETF is trading this morning at $112.69, up about 0.3%, which indicates that yields are declining slightly.

All of this information seems to point to an auction yield today of about 0.33%, well below the 0.497% that a similar auction drew six months ago.

I’ll return after the auction closes at 1 p.m. to post the results and then later to add some reaction.

Posted in Investing in TIPS | Leave a comment

Up next: 10-year TIPS reopens at auction May 21, 2015

It’s been an interesting couple of weeks for Treasury Inflation-Protected Securities, and all government bonds. Yields are rising – the 10-year German bund, for example, is currently yielding 0.73%, up from 0.07% just three weeks ago. In that same time, the yield on a 10-year US Treasury rose from 1.87% to 2.27%. And the yield on a 10-year TIPS rose from -0.02% to 0.41%.

So rates are on the rise, and while this makes TIPS more appealing as an investment, it strikes hard at TIPS mutual funds. The price of the broadly invested TIP ETF, for example, has fallen from $115.49 on April 17 to $112.16 on May 13, a decline of 2.9%.

All of this is leading up to a reopening auction next week of CUSIP 912828H45, which first auctioned on Jan. 22 with a real yield to maturity (after inflation) of 0.315% and a coupon rate of 0.250%. It reopened on March 19 with a real yield of 0.2%, the lowest yield for an 9- to 10-year TIPS at auction since May 2013.

Thursday’s 9-year, 8-month auction will be the final reopening of this TIPS, and it could end up being a fairly attractive offering. Here is where things stand today:

  • This TIPS is currently trading on the secondary market. Bloomberg’s Current Yields page shows it trading at 0.37% this morning – with a price of about $98.88 per $100 of par value. It is priced at a discount because the yield is higher than that coupon rate of 0.250%.
  • The Wall Street Journal’s Closing Prices page shows this TIPS – which matures on Jan. 15 2025 – closed Wednesday with a yield of 0.370% and the same price, about $98.88 for $100 of par value.
  • You can also see on that WSJ chart that this TIPS has an inflation index of 0.993, which means it hasn’t yet risen to par value after several months of deflation. This index will rise to 0.996 on the auction closing date of May 29, which will also slightly lower its adjusted price at auction. View detailed index data.
  • Finally, the US Treasury’s Real Yields Curve page, which estimates the yield of a full-term 10-year TIPS, showed a yield of 0.41% yesterday.

This auction is a week out, and a lot can happen in a week. But at this point it looks like this TIPS could end up with an after-inflation yield in the 0.35% to 0.45% range, and it will be priced at a discount.

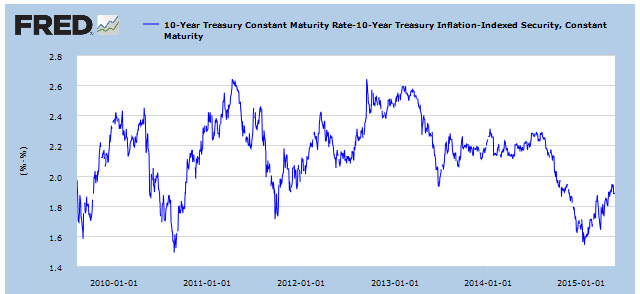
Inflation breakeven rate. If we peg this TIPS at 0.37% and the 10-year nominal Treasury at 2.27%, we get an inflation breakeven rate of 1.90%, still in the cheap range but creeping toward the neutral area (2.0% to 2.5%). This means if inflation averages more than 1.9% over the next 10 years, this TIPS will outperform at traditional Treasury. And I’d say that number will make this TIPS attractive for many investors. Here is a five-year chart of breakeven rates for the 10-year TIPS:

breakeven ratesKey question. Are higher yields coming? Who knows. The Treasury will offer a new 10-year TIPS in July and that one will reopen in September and November. An investor who thinks yields will be rising can afford to wait for that new July issue.

Here is the history of all 9- to 10-year TIPS auctions since January 2008. Study this chart, and you can see it has been a wild ride. Is 0.40% a ‘normal’ after-inflation yield for a 10-year TIPS? It might be today, but not in the past.

10-year TIPS auctions

Posted in Investing in TIPS | 3 Comments