
A brief history. The Federal Reserve started its latest round of quantitative easing (QE3, in this case) on Sept. 13, 2012, when it launched a $40 billion per month program to buy mortgage-backed securities. This eventually morphed into ‘Operation Twist’ in December 2012 when the bond buying expanded to long-term Treasurys and bumped up to $85 million a month.

SOURCE: Wall Street Journal
This launched a period of severely low interest rates, especially for Treasury Inflation-Protected Securities. On Sept. 17, 2012, I posted ‘Are TIPS a good investment in 2012?‘ which I answered with one word: No. (But then I rambled on, of course.)
On June 12, 2013, then-Fed-Chairman Ben Bernanke announced a ‘tapering’ of the bond-buying program, which finally ended this month. So for now, there technically is no active QE program, but the Fed continues to hold a massive portfolio of Treasurys and mortgage-backed securities, which at this point it can’t unload. This is from an excellent analysis in yesterday’s Wall Street Journal:
The central bank’s holdings of securities, loans and other assets have increased from $2.825 trillion when the program started to $4.482 trillion. The Fed has said it plans to maintain this level of holdings until after it starts raising short-term interest rates. Eventually, officials expect to reduce the holdings gradually by letting securities mature without reinvesting the proceeds.
What QE has meant for TIPS. My belief is that the September announcement of QE3 and the December 2012 expansion set up TIPS for a mighty fall in 2013. TIPS yields were already extremely low in mid-2013, and a new round of QE set off fears of future inflation, which bolstered the appeal of TIPS. Prices rose and yields fell.
Inflation, however, never became a factor, rising to just over 2% a year in early 2014 before slipping back down to 1.7%. So as the economy improved, and overall interest rates began rising in mid-2013, the appeal of TIPS was declining. A double whammy, resulting in a -8.65% drop in the TIP ETF in 2013.
This chart summarizes what has happened since QE3 was launched in September 2012:
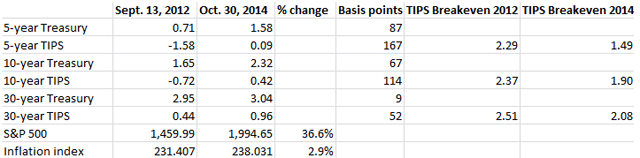 There are several striking statistics to consider in this chart:
- TIPS inflation breakeven rates have plummeted in the two years since QE3 was launched, dropping 50 basis points for a 5-year TIPS, 47 basis points for a 10-year TIPS and 43 basis points for a 30-year TIPS. Despite two years of Fed stimulus, inflation expectations are very low.
- The stock market, represented by the S&P 500, has had a great run, rising 36.6%.
- Despite that surge in wealth, inflation has been muted – rising just 2.9% overall in the 25 months of QE3.
- The yield on a 30-year Treasury has barely budged, rising just 9 basis points. Compare that with the yield of a 5-year TIPS, rising a whopping 167 basis points.
Conclusion. QE3 was expected to bolster TIPS, but that was a false premise back in 2012. Inflation didn’t rise, yet interest rates did eventually rise, and that caught TIPS investors in a bind: yields rising faster than the overall bond market.
On the other hand, today’s very low breakevens for TIPS across the maturity scale make them a much more attractive investment than they were in 2012. And those low breakevens give TIPS investors a ‘margin of safety’ …. because TIPS yields may now rise at a slower pace than the overall bond market, just the opposite of what happened in 2013.
I wouldn’t call TIPS a ‘buy’ in October 2014, but their appeal is rising.

John, I’d say that a 10-year TIPS yielding 1% plus inflation would mark a return to ‘more normal’ returns. In late 2013 the yield rose to 0.92%, very close, but then fell off again in 2014. This would equate to a price of about $110 in the TIP ETF, about 3% lower than it is today. (However, I should note I did buy the September reopening of a 10-year TIPS at auction, with a yield of 0.61%. It looked the best I was going to get in 2014, so I made a small purchase.)
Hi David,
I am new to investing and stumbled on your blog while researching TIPS. It’s been extremely valuable, so thank you.
Question — so what signals would you look out for that signal a “buy” for TIPS? And why?