
May 22 update: Reopening option gets real yield of 2.220%
By David Enna, Tipswatch.com
The U.S. Treasury on Thursday will auction $18 billion of a reopened 10-year Treasury Inflation-Protected Security, CUSIP 91282CML2. The result will be a 9-year, 8-month TIPS with an already-set coupon rate of 2.125%.
At this point — Sunday a week before the auction — it looks like the real yield to maturity could be around 2.11% and the inflation breakeven rate at 2.32%. But a lot can change before the auction, which will close at 1 p.m. Thursday. These are volatile times in the U.S. bond market.
Definition: The “real yield to maturity” of a TIPS is its yield above official future U.S. inflation, over the term of the TIPS. So a real yield of 2.11% means an investment in this TIPS would provide an annual return that exceeds U.S. inflation by 2.11% for 9 years, 8 months.
CUSIP 91282CML2 had its originating auction on January 23, when it generated a real yield to maturity of 2.243%, the highest auction result for this term in 16 years. That auction set the coupon rate at 2.125%.
It then had its first reopening auction on March 20, with a real yield to maturity of 1.935%. Thursday’s auction will close the books on CUSIP 91282CML2, and the Treasury will auction a new 10-year TIPS on July 24.
So now — potentially — investors have a chance to grab a 10-year TIPS (either at auction or on the secondary market) with a real yield above 2%, a historically attractive milestone. Of course, real yields can continue rising; there is no guarantee. But a 2% yield above future inflation is a solid investment, if the TIPS is held to maturity.
Here is the trend in the 10-year real yield over the last 15 years, showing that yields remain near 15-year highs:

Pricing
Friday’s closing real yield of 2.11% is just slightly below the coupon rate of 2.125%, so CUSIP 91282CML2 is currently trading at a slightly premium price of 100.13. In addition it will have an inflation index of 1.01320 on the settlement date of May 30. So if the real yield holds at 2.11% at the auction (it won’t be exactly that, but this is an example) here is the investment cost of a $10,000 par value purchase:
- Par value: $10,000.
- Inflation-adjusted principal: $10,132.
- Cost of investment: $10,132 x 1.00132 = $10,145.37
- + accrued interest of about $80.
In summary, under this scenario an investor would pay $10,145.37 for $10,132 of principal. From that point on, the investment would grow with accruals on principal matching U.S. inflation, plus receive annual coupon interest of 2.125%.
Inflation breakeven rate
The 10-year nominal Treasury note closed Friday with a yield of 4.43%, giving this TIPS an inflation breakeven rate of 2.32%, a historically high number but in the range of recent auctions. Inflation over the last 10 years, ending in April, averaged 3.1%.
If you think inflation is going to average higher than 2.32% over the next 9 years, 8 months, buy the TIPS. If not, invest in the nominal Treasury. Here is the trend in the 10-year inflation breakeven rate over the last 15 years, showing the breakeven hovering in the 2% to 2.5% range over the last three years:

Thoughts
If you are interested in CUSIP 91282CML2, you can swoop in at any time and buy it on the secondary market, if you see a real yield you like. The advantage there is you will know the exact real yield you are receiving. The advantage of buying at auction, especially through TreasuryDirect, is that even small-lot purchases will get the auction’s high yield.
Either way, if the real yield holds around 2.11%, this will be an attractive auction. I won’t be a buyer, since I purchased my 2035 allotment at the January auction, when the real yield was slightly higher. Reminder: There is no way to know where real yields are heading. Higher U.S. deficits certainly could result in higher yields for longer-term Treasurys.
You can track the real yield of this TIPS in real time on Bloomberg’s Yields Curve page. It is the 10-year TIPS listed there.
This TIPS auction closes Thursday at 1 p.m. EST. Non-competitive bids at TreasuryDirect must be placed by noon Thursday. If you are putting an order in through a brokerage, make sure to place your order Wednesday or very early Thursday, because brokers cut off auction orders before the noon deadline.
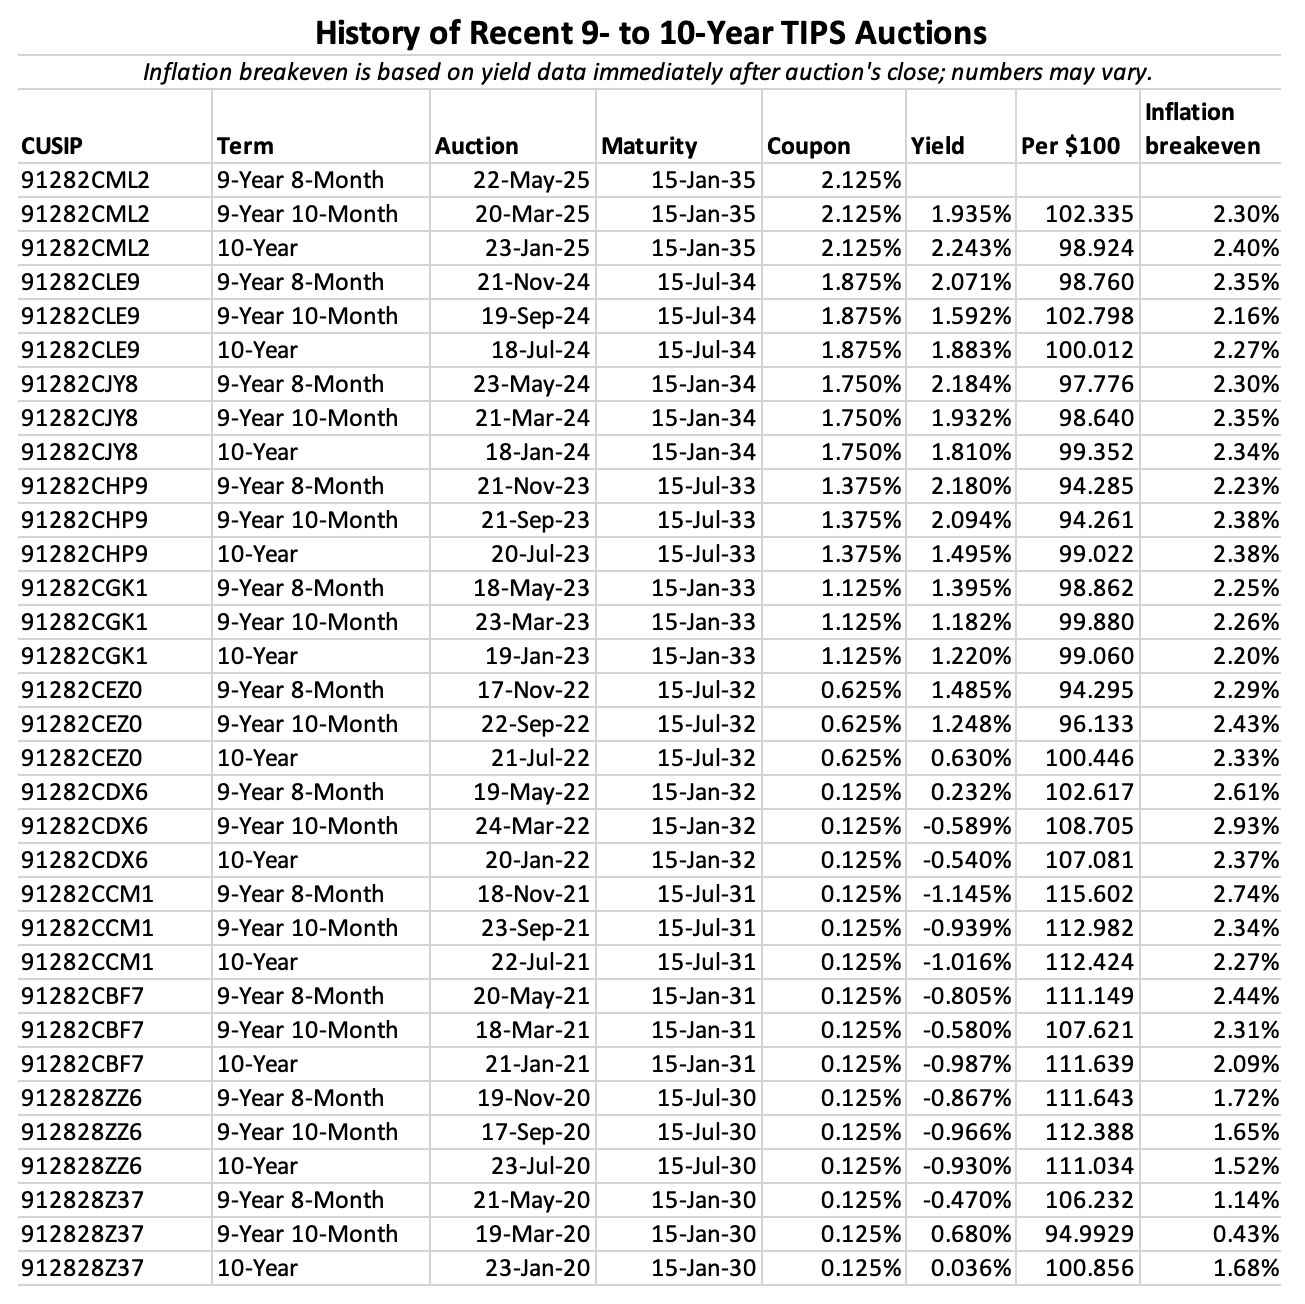
I will be posting the auction results soon after the close, but my timing is uncertain since I am traveling this week in Scandanavia, with a six-hour time difference. Here is a history of auction results for this term over the last 5 years:
• Now is an ideal time to build a TIPS ladder
• Confused by TIPS? Read my Q&A on TIPS
• TIPS in depth: Understand the language
• TIPS on the secondary market: Things to consider
• TIPS investor: Don’t over-think the threat of deflation
• Upcoming schedule of TIPS auctions
* * *
Follow Tipswatch on X for updates on daily Treasury auctions and real yield trends (when I am not traveling).
Feel free to post comments or questions below. If it is your first-ever comment, it will have to wait for moderation. After that, your comments will automatically appear. Please stay on topic and avoid political tirades. NOTE: Comment threads can only be three responses deep. If you see that you cannot respond, create a new comment and reference the topic.
David Enna is a financial journalist, not a financial adviser. He is not selling or profiting from any investment discussed. I Bonds and TIPS are not “get rich” investments; they are best used for capital preservation and inflation protection. They can be purchased through the Treasury or other providers without fees, commissions or carrying charges. Please do your own research before investing.
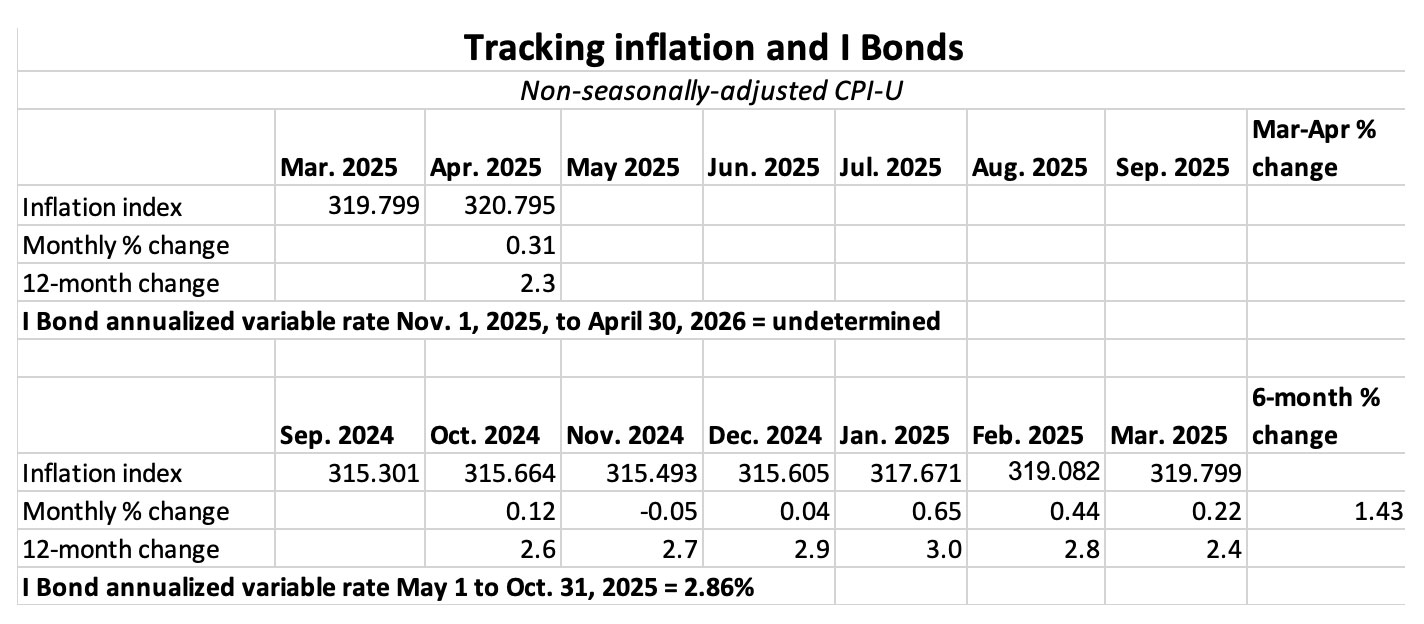

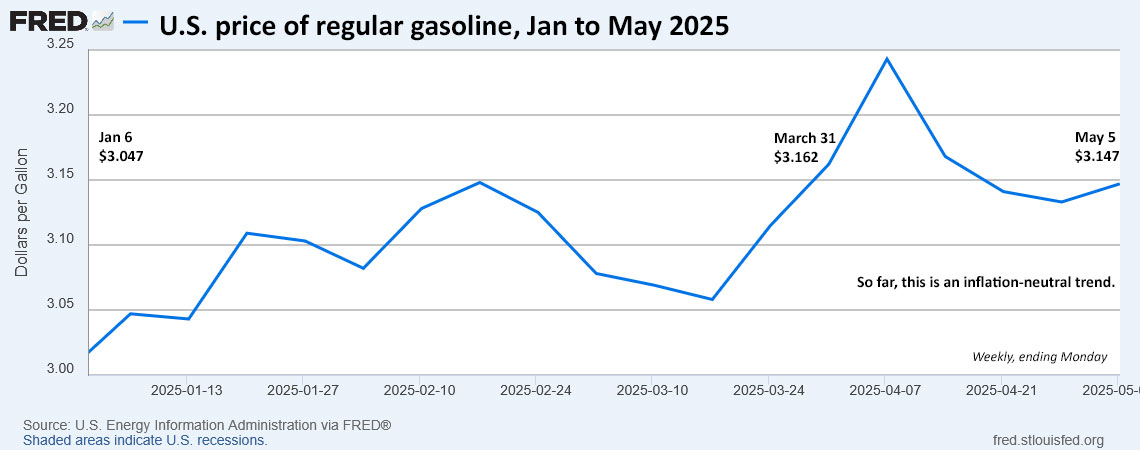


It definitely caused at least a small reduction in six-month inflation. What's amazing is if the United States didn't attack…