What will be the effect of ‘big beautiful’ tax refund checks?
By David Enna, Tipswatch.com
Last week I read a report by David Kelly, chief global strategist at JPMorgan Asset Management, that mirrored some of my concerns that sizable federal tax refunds could set off a short-lived inflation surge in 2026.
On August 7th, with little fanfare, the IRS announced that, as part of its phased implementation of the OBBBA (One Big Beautiful Bill Act), it would not be adjusting W2 or 1099 forms for the current calendar year but would provide guidance and new forms, in due course, for calendar 2026.
This seemingly innocuous statement confirms that we will see an even larger crop of personal income tax refunds early in 2026 than was anticipated when the OBBBA was passed. These higher income tax refunds should work much like a new round of stimulus checks, adding to consumer demand and inflation pressures early next year.
Kelly notes that at the same time the refund checks will be flowing, the Federal Reserve may be cutting short-term interest rates, creating a “sugar rush” of consumer spending. He theorizes:
When their effects fade, it is quite possible that Washington will provide yet another round of stimulus to boost demand ahead of the mid-term elections.
Measuring the surge
Kelly notes that most of the OBBBA’s tax breaks are backdated to Jan. 1, 2025, but the IRS will not be issuing new W2 withholding schedules for 2025. The result is that “far too much money will have been withheld from taxpayers and refunds will surge in early 2026.”
But how much? Kelly theorizes: “(T)he total cost of these provisions for fiscal 2027, at $116 billion, should be very close to the amount owed to taxpayers for calendar 2025, deflated by, say 8%, for the growth in income in between – so roughly $107 billion.”
JP Morgan estimates the average tax refund in early 2026 will be $3,743, up about $500 from the 2025 level.
Looking at the overall economic impact, if we assume that 80% of these extra refunds are spent, this amounts to roughly 0.27% of GDP. If this money were spent evenly in the first six months of 2026, it could boost annualized real GDP growth by over 0.5% in the first quarter. If we add to this the impact of lower withholding that should finally kick in at the start of 2026, it could add 0.8% to real GDP growth in the first quarter. ….
If consumers generally use this money quickly, then by the third quarter of next year, consumer spending could slow again and, by the fourth quarter, it could slump. …
It could well be that, faced with this possibility, Congress approves some further fiscal stimulus such as the “DOGE dividends” that were floated earlier this year or the more recently proposed “tariff rebate checks”.
And then what?
Kelly speculates the Federal Reserve will lower interest rates by 25 basis points on Sept. 17, which seems fairly locked in. He adds, “Such a move is unlikely to spur faster economic growth in the short run, setting the stage for another rate cut in October or in December or both.”
So … two or three cuts to short-term interest rates could come just months before the bigger tax refund checks begin rolling out through the first half of 2026. Kelly concludes:
(I)nvestors might doubt the Fed’s commitment to stable inflation, potentially leading to a steeper yield curve, a lower dollar and lower stock prices. For investors, this underscores the need to have a greater allocation to international assets denominated in foreign currencies and the importance of having alternative assets with lower correlations to U.S. stocks and bonds.
My thoughts
It was my theory that several of the OBBBA provisions had the potential to be inflationary in the near term — no taxes on tips, no taxes on overtime, larger senior standard deduction, a new break for auto-loan interest, higher state-and-local tax deductions. The result: more money for consumers to spend.
Kelly’s assumptions make sense, in that a $500 boost to income tax refunds (along with other tax breaks) could trigger more aggressive consumer spending, which in turn could spur inflation higher. Plus, once 2026 begins, W2 withholding levels will be adjusted, giving many consumers an increase in take-home pay.
Will consumers rush to spend? I recall, unfortunately, the sudden explosion of hot-rod vehicles on Charlotte streets during the COVID stimulus roll-outs. For some people, the money was going to down payments on a depreciating asset. Not good.
Or, we could hope, people would try to pay down personal debt. In mid-2025, the average American family was carrying $6,371 in credit card debt, the highest level since the New York Fed started tracking this in 1999.
—————————
Donate? This site is free and I plan to keep it that way. Some readers have suggested having a way to contribute. I would welcome donations. Any amount, or skip it, your choice. This is completely optional.
Follow Tipswatch on X for updates on daily Treasury auctions and real yield trends (when I am not traveling).
Feel free to post comments or questions below. If it is your first-ever comment, it will have to wait for moderation. After that, your comments will automatically appear. Please stay on topic and avoid political tirades.NOTE: Comment threads can only be three responses deep. If you see that you cannot respond, create a new comment and reference the topic.
David Enna is a financial journalist, not a financial adviser. He is not selling or profiting from any investment discussed. I Bonds and TIPS are not “get rich” investments; they are best used for capital preservation and inflation protection. They can be purchased through the Treasury or other providers without fees, commissions or carrying charges. Please do your own research before investing.
IMPORTANT NOTE: I wrote this article on Wednesday to be published Sunday while I am visiting family out of town. It appears that Vanguard has backed off on raising the bond minimum to $10,000, based on Boglehead discussions posted Saturday and today.
The note announcing the change has been removed from the trading platform. If anyone gets further updates please post them in the comments.
A rather ominous AI image for “Bond investors locked out of market.” Source: Google Gemini
By David Enna, Tipswatch.com
A few years ago, I was writing about bid-ask spreads for TIPS on the secondary market and noted I was able to purchase a “very small” order of $10,000 with a bid-ask spread only 2 basis points below a high-dollar purchase..
What I meant: In the world of TIPS trading, $10,000 is an insignificant amount. But a reader immediately jumped all over me for saying a $10,000 purchase is “very small” and noted that a lot of investors can’t afford that large a purchase.
Point taken and lesson learned. But then last week we got this message at the top of Vanguard’s bond-trading platform:
Click on image for larger version. (This notice has now been removed from the Vanguard site.)
As of September 13, Vanguard said, it would raise its minimum bond purchase, currently $1,000 par value, to $10,000. That would apply to all bond purchases — including Treasury auctions. Only new issue CDs would be exempt from the new policy.
That would be a dramatic and unwelcome change.
I know that many Tipswatch readers use the Vanguard site to make small Treasury auction purchases, especially for T-bills. For example, an investor could buy $1,000 in 4-week Treasurys every month and then roll them over to cap out at $12,000 in one year. That makes sense for an investor who can’t afford a one-time $10,000 investment.
From my own experience: When TIPS real yields were just starting to rise from below-zero in April 2022 I began “nibbling” into TIPS at auction, usually with $5,000 purchases. That would no longer be allowed.
And this year, as TIPS and other investments in my traditional IRA have matured or paid interest, I have purchased T-bills maturing before the end of the year to prepare for RMDs beginning in January 2026. All of those purchases were less than $10,000.
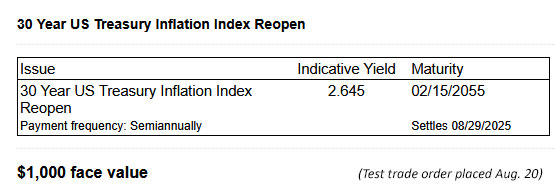
As of last week, you could still do a $1,000 minimum purchase for a TIPS auction, as shown in this quote from Wednesday. That option would have ended on September 13, five days before the next TIPS auction of a reopened 10-year.
I tend to do all my individual bond purchases on the Vanguard site, where I have my individual IRA. I also have an account at Fidelity, where $1,000 remains the minimum bond purchase for a Treasury auction. TreasuryDirect has a $100 minimum.
At all brokerages, bond sellers set minimum lot-size amounts, which will vary and will often lock out a $1,000 purchase. Vanguard said its new policy would not apply to “sell orders” — which are placed on an exchange outside of Vanguard — so it may be possible to find sellers still allowing $1,000-lot offers. I find this very confusing.
Clearly, however, auction purchases would have had a $10,000 minimum.
Why do this?
Vanguard has not stated its reasoning for this move (or the apparent reversal), which is going to lock some investors, especially small-scale investors, out of buying individual bonds. And then what? In Vanguard’s brief announcement, it provides a link to “other products that have lower minimums.” The link goes to a page titled “Investment products: Mutual funds, ETFs and more,” which actually offers no advice at all on products with low minimum investments.
Obviously, Vanguard’s reason No. 1 is cost savings, because these small-lot bond purchases entail some costs and some Treasury purchases have zero commissions. So Vanguard’s aim is to get you out of this market and into one of its other, more profitable products.
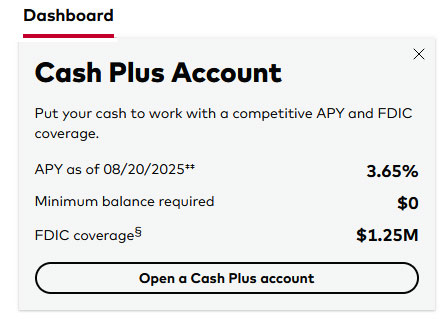
For evidence, just look at the top left corner of your account dashboard for a prominent ad promoting Vanguard’s new and heavily promoted Cash Plus Account:
I don’t have a Vanguard Cash Plus Account (I use Fidelity’s Cash Management Account instead). Vanguard’s version is probably a fine product — and it has no minimum investment — but it is currently paying 3.65% versus 4.24% for Vanguard’s much-loved Vanguard Treasury Money Market Fund (VUSXX).
Of course, I totally accept that a cash management account — with its flexibility for bill payments and withdrawals — would have a higher expense ratio than VUSXX’s ultra-low 0.07%. Fidelity’s CMA allows access to its Treasury Money Market Fund (FZFXX), currently yielding 3.93%. Its expense ratio is 0.42%.
By increasing its minimum bond investment to $10,000, was Vanguard trying to prod small-scale investors to move into its Cash Plus Account? For many investors, that could actually be a smart move. But for others, the higher bond minimum is at least an annoyance.
Reaction or over-reaction?
Vanguard has apparently reversed this $10,000 minimum before it went into effect. I hope that is true and the decision was based on strong investor feedback.
In my case, why buy T-bills in a traditional IRA when I can (and do) use VUSXX for idle cash? The yields are going to be similar. The reason is psychological, I guess, in that I am trying to use T-bills to set aside cash for a specific purpose — in my case, future required minimum distributions.
Other investors may be setting aside locked-up cash for property taxes, wedding expenses, a car purchase, even I Bond purchases next year. Or maybe they want to build a 10-year bond ladder with $5,000 in each year? The new $10,000 minimum is going to throw a wrench into those strategies.
This isn’t an Earth-shattering policy change. But it would affect investing plans for some of Vanguard’s customers.
Years ago, I had a cash account at Wells Fargo that paid current money market rates. For a long time, that rate was about 0.05%, but then over a half year yields surged higher to about 3.0%. I was pleased. Within a month, Wells announced it was changing the terms and the rate dropped to 0.05%, where it remains. I pulled nearly all my investments from Wells Fargo.
I won’t do the same with Vanguard. I am just going to announce that I am disappointed with this decision from an investment firm I have trusted and admired for four decades.
—————————
Donate? This site is free and I plan to keep it that way. Some readers have suggested having a way to contribute. I would welcome donations. Any amount, or skip it, your choice. This is completely optional.
Follow Tipswatch on X for updates on daily Treasury auctions and real yield trends (when I am not traveling).
Feel free to post comments or questions below. If it is your first-ever comment, it will have to wait for moderation. After that, your comments will automatically appear. Please stay on topic and avoid political tirades.NOTE: Comment threads can only be three responses deep. If you see that you cannot respond, create a new comment and reference the topic.
David Enna is a financial journalist, not a financial adviser. He is not selling or profiting from any investment discussed. I Bonds and TIPS are not “get rich” investments; they are best used for capital preservation and inflation protection. They can be purchased through the Treasury or other providers without fees, commissions or carrying charges. Please do your own research before investing.
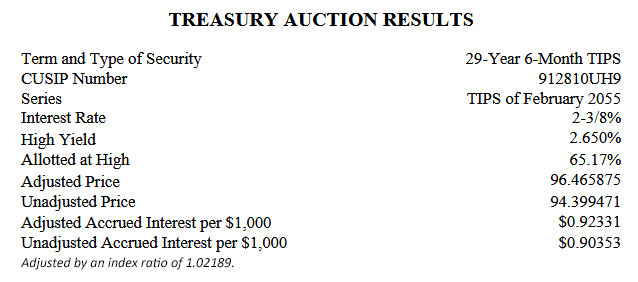
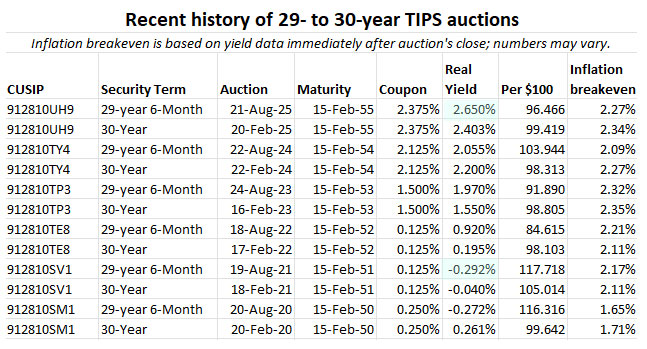
Investors were ready and willing to jump aboard today’s auction of a reopened 30-year Treasury Inflation-Protected Security, CUSIP 912810UH9. And why not? The resulting real yield to maturity of 2.650% was the highest for this term at auction since October 2001.
This TIPS will mature February 15, 2055. It has a coupon rate of 2.375%, which was set by the originating auction on February 20, 2025.
Demand at this auction looked strong. The “when-issued” yield prediction was 2.673%, but bidders brought that down to 2.650%. The bid-to-cover ratio was 2.78, much higher than recent auctions of this term. There is a market for 30-year TIPS!
Definition: The “real yield to maturity” of a TIPS is its yield above official future U.S. inflation, over the term of the TIPS. So a real yield of 2.65% means an investment in this TIPS would provide a return that exceeds U.S. inflation by 2.65% for 29 years, 6 months.
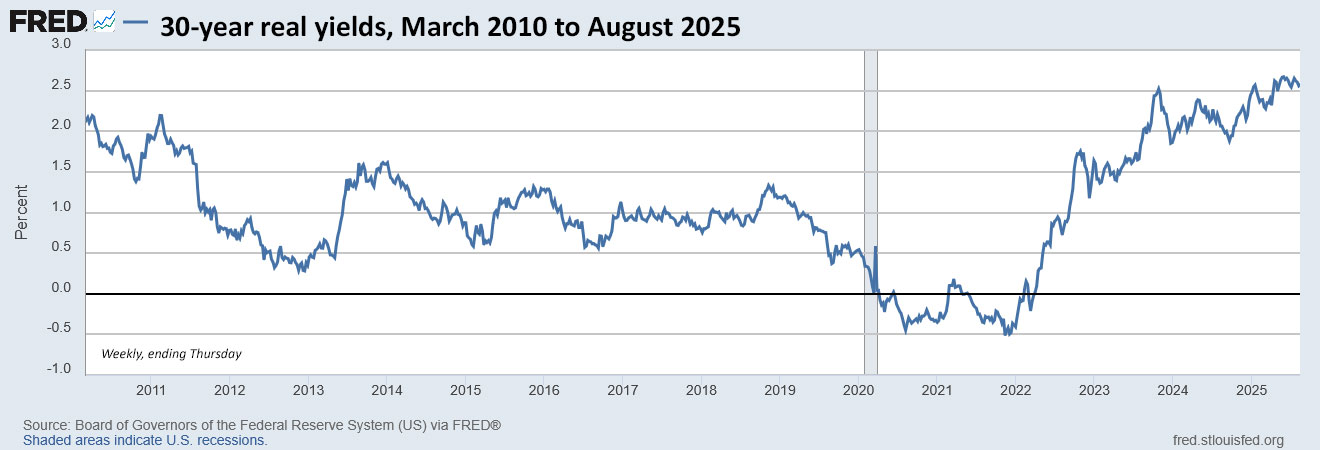
As I noted in my preview article for this auction, the Treasury halted 30-year TIPS auctions from October 2001 to February 2010. Before 2001, auctioned real yields were much higher across all maturities of TIPS. But today’s above-inflation yield of 2.650% was nearly 25 basis points higher than any other auction of this term since 2010.
Here is the trend in the 30-year real yield over the last 2 1/2 years:
Click on image for larger version.
Pricing
Because the auction’s real yield of 2.650% was well above the coupon rate of 2.375%, investors got this TIPS at a substantial discount, an unadjusted price of 94.399471. In addition, it will carry an inflation index of 1.02189 on the settlement date of Aug. 29. With that information, we can calculate the exact cost of a $10,000 investment:
Par value purchased: $10,000.
Principal on settlement date: $10,000 x 1.02189 = $10,218.90
Cost of investment: $10,218.90 x 0.94399471 = $9,646.59
+ accrued interest of $9.23
In summary, an investor placing an order for $10,000 of this TIPS paid $9,646.59 for $10,218.90 of principal as of the August 29 settlement date. From then on, the investor will earn inflation accruals matching U.S. inflation, plus an annual coupon rate of 2.375% for the next 29 years, 6 months.
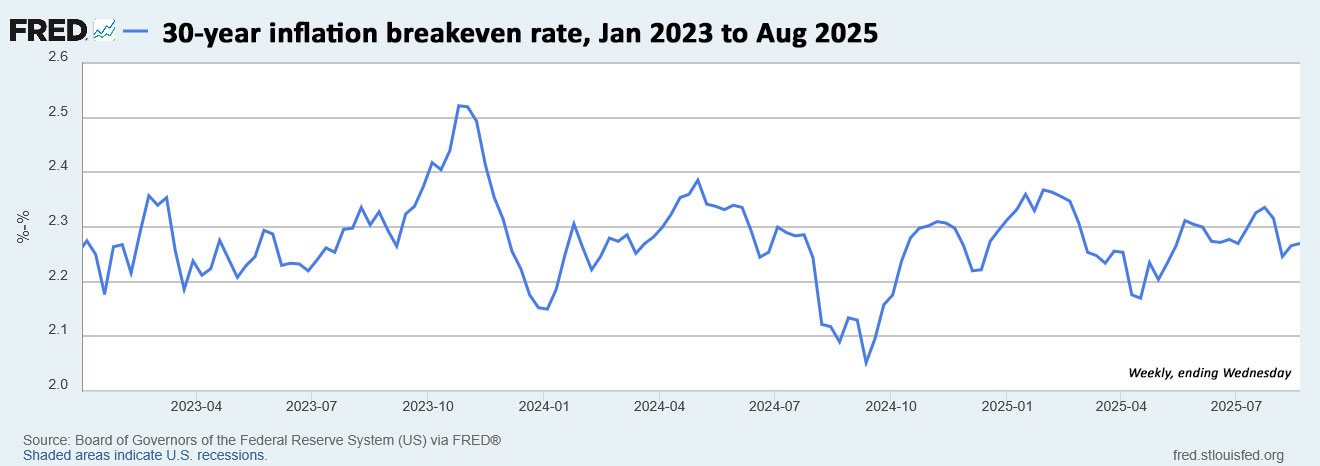
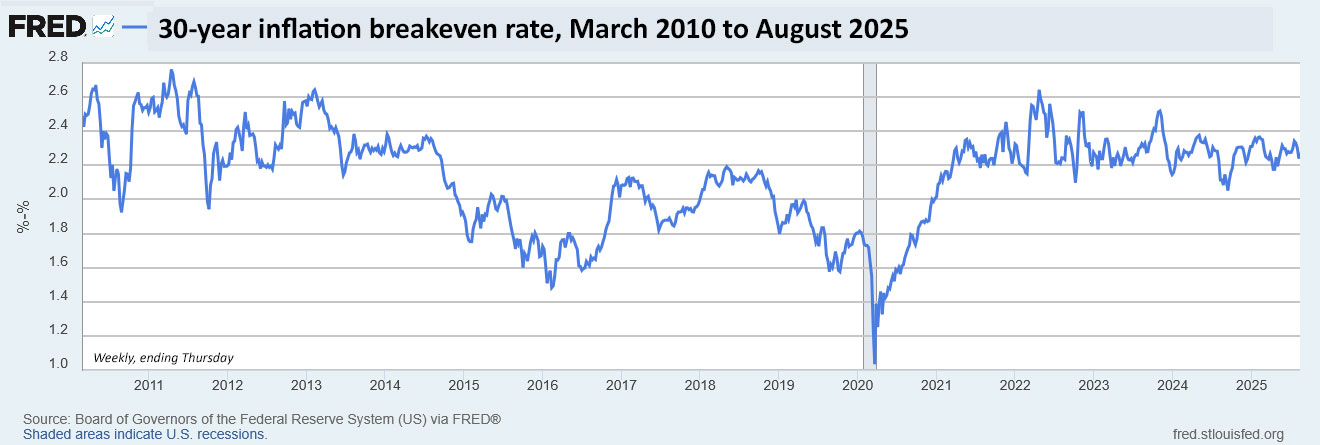
Inflation breakeven rate
The 30-year Treasury bond was trading with a nominal yield of 4.92% at the auction’s close, so this TIPS gets an inflation breakeven rate of 2.27%, in line with recent auction results. This means it will outperform the nominal bond if inflation averages more than 2.27% over the next 29 years, 6 months.
Some perspective: Look at 30-year inflation averages over the last 55 years. Only one 30-year period (ending in 2020) had average inflation of 2.2%. Every other one was higher.
The inflation breakeven rate isn’t truly a prediction of future rates. It is a measure of current sentiment. Here is the trend in the 30-year inflation breakeven rate over the last 2 1/2 years:
Click on image for larger version.
Reaction
For daring investors willing to take on the very long term, this TIPS ended up being a strong investment. Yes, real yields could continue to climb, but getting 2.65% above inflation makes for a strong asset — one you couldn’t find for nearly 24 years.
The auction result wasn’t much of a surprise, but demand was strong. That hasn’t always been true for this 30-year term, one reason the Treasury has kept auction sizes steady for four years, while bumping up sizes for 5- and 10-year TIPS.
For today’s buyers, I just want to point out that just four years ago this same term and same auction size got a real yield of -0.292%. Today’s result was a whopping 294 basis points higher. Congrats on your purchase.
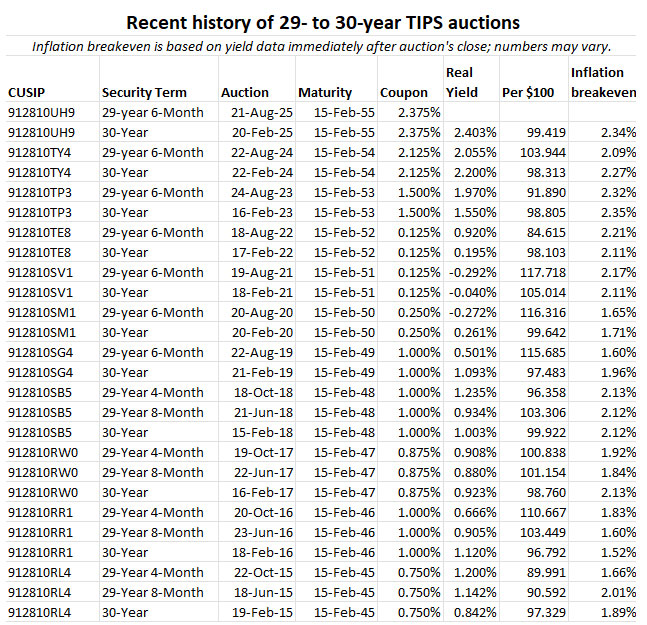
Here are auction results for this term over the last five years:
Donate? This site is free and I plan to keep it that way. Some readers have suggested having a way to contribute. I would welcome donations. Any amount, or skip it, your choice. This is completely optional.
Follow Tipswatch on X for updates on daily Treasury auctions and real yield trends (when I am not traveling).
Feel free to post comments or questions below. If it is your first-ever comment, it will have to wait for moderation. After that, your comments will automatically appear. Please stay on topic and avoid political tirades.NOTE: Comment threads can only be three responses deep. If you see that you cannot respond, create a new comment and reference the topic.
David Enna is a financial journalist, not a financial adviser. He is not selling or profiting from any investment discussed. I Bonds and TIPS are not “get rich” investments; they are best used for capital preservation and inflation protection. They can be purchased through the Treasury or other providers without fees, commissions or carrying charges. Please do your own research before investing.
The U.S. Treasury on Thursday will offer $8 billion in a reopening auction of CUSIP 912810UH9, a 30-year Treasury Inflation-Protected Security. The auction, which will create a 29-year, 6-month TIPS, has the potential to set a multi-decade high for real yield.
This TIPS originally auctioned February 20, generating a real yield to maturity of 2.403%, the highest in 23 years for this term. Its coupon rate was set at 2.375%, also the highest for this term in 23 years.
CUSIP 912810UH9 trades on the secondary market. According to Bloomberg’s U.S. Yields, it closed Friday with a real yield of 2.65%, well above the February record. The U.S. Treasury is currently estimating the real yield of a full-term 30-year TIPS at that same number, 2.65%.
Definition: The “real yield to maturity” of a TIPS is its yield above official future U.S. inflation, over the term of the TIPS. So a real yield of 2.65% means an investment in this TIPS would provide a return that exceeds U.S. inflation by 2.65% for 29 years, 6 months.
Reality check. When I talk about a nearly 24-year high, I have to note that the Treasury stopped offering 30-year TIPS from October 2001 to February 2010. Before 2001, auctioned real yields were much higher across all maturities of TIPS, which were very new and little understood at the time. These early TIPS were spectacular investment opportunities.
So what we are really looking at is the 15-year history of the 30-year TIPS since 2010, which is charted here and clearly shows that the above-inflation yield in August 2025 is historically significant:
Click on image for larger version
Dangers of the 30-year term
My investment philosophy for TIPS is: buy and hold to maturity. For an investor with a 30-year time-frame — say someone aged 50 to 60 — this week’s TIPS auction should be attractive, potentially as the top rung of TIPS investment ladder. It should also be attractive for TIPS traders willing to bet that real yields will be declining in the future.
A 30-year TIPS is highly volatile. For example, a 30-year TIPS issued just three years ago — CUSIP 912810TE8 — auctioned with a real yield of 0.195% and a coupon rate of 0.125%. Today, that TIPS is trading with a real yield of 2.67% and a price of 51.90, meaning it has lost nearly 50% of its market value in three years.
(Side note: On the day of that 2022 auction, February 17, the 30-year Treasury bond had a nominal yield of 2.31%, less than real yield of similar TIPS today.)
That February 2022 30-year auction was potentially disastrous for investors who could not hold to maturity. This week’s auction is much more attractive, and offers some potential for capital gains for TIPS traders. But that would backfire if real yields continue rising.
Want to speculate? Go for it. My recommendation is always to buy a TIPS with the plan to hold to maturity.
Pricing
At Friday’s close CUSIP 912810UH9 was trading with a discounted price of 94.38 because the market real yield of 2.65% was above the coupon rate of 2.375%. This will likely change before the Thursday auction, but can give us an idea of pricing:
Par value purchased: $10,000
Inflation index on Aug. 29 settlement date: 1.02189.
Actual principal purchased: $10,000 x 1.02189 = $10,218.90
Cost of investment: $10,218.90 x 0.9438 = $9,644.60
+ accrued interest of about $9.23.
So in this scenario — meant to be an illustration — an investor would pay $9,644.60 for $10,218.90 in principal as of the settlement date of August 29. From then on, the investor would earn accruals matching future inflation, plus an annual coupon rate of 2.375% paid on inflation-adjusted principal for 29 years, 6 months.
Inflation breakeven rate
The 30-year Treasury bond closed Friday with a nominal yield of 4.92%, which means this TIPS at 2.65% would have an inflation breakeven rate of 2.27%, more or less in line with recent auctions of this term. This means it will out-perform the nominal Treasury if inflation averages more than 2.27% over the next 29 years, 6 months. (Inflation over the last 30 years, ending in July, has averaged 2.5%.)
My quick impression is that a 30-year nominal approaching 5% is pretty attractive. But I’d still prefer the inflation-protection that comes with the TIPS. Here is the trend in the 30-year inflation breakeven rate over the last 15 years:
Click on image for larger version.
This chart is historically stunning, in my opinion, with 30-year inflation expectations waffling between 2.2% to 2.4% for nearly four years. This seems to be a remarkably consistent view of future inflation — which probably means it will be wrong.
Thoughts on the auction
There is no particular reason to wait for Thursday’s auction to purchase CUSIP 912810UH9 unless you want to buy a small amount at TreasuryDirect. If you have access to a major brokerage, this TIPS is trading on the secondary market and can be purchased any time you see a real yield you like.
The advantage of buying at auction, especially through TreasuryDirect, is that even small-lot purchases will get the auction’s high yield. The advantage of the secondary market is that you can see exactly the price and real yield you will be receiving. The negative is that you may face a small bid-ask spread. Most of the time, it doesn’t make a huge difference, but if you see a real yield you like, know that you can probably get it on the secondary market without dealing with the auction’s uncertainty.
I won’t be a buyer because my TIPS ladder tops out in 2043, when in theory I will be 90 years old. I don’t think I need to extend beyond that year.
For the right buyer with a true plan to hold to maturity, I think CUSIP 912810UH9 looks like a solid investment. As always, do your own research.
This TIPS auction closes Thursday at 1 p.m. ET. Non-competitive bids at TreasuryDirect must be placed by noon Thursday. If you are putting an order in through a brokerage, make sure to place your order Wednesday or very early Thursday, because brokers cut off auction orders before the noon deadline.
Here is a history of auctions of this term over the last 10 years:
Donate? This site is free and I plan to keep it that way. Some readers have suggested having a way to contribute. I would welcome donations. Any amount, or skip it, your choice. This is completely optional.
Follow Tipswatch on X for updates on daily Treasury auctions and real yield trends (when I am not traveling).
Feel free to post comments or questions below. If it is your first-ever comment, it will have to wait for moderation. After that, your comments will automatically appear. Please stay on topic and avoid political tirades.NOTE: Comment threads can only be three responses deep. If you see that you cannot respond, create a new comment and reference the topic.
David Enna is a financial journalist, not a financial adviser. He is not selling or profiting from any investment discussed. I Bonds and TIPS are not “get rich” investments; they are best used for capital preservation and inflation protection. They can be purchased through the Treasury or other providers without fees, commissions or carrying charges. Please do your own research before investing.
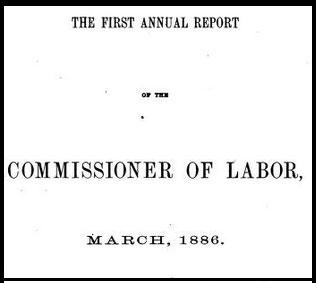
We have worked closely with the Bureau of Labor Statistics for decades and, in the belief that people are more likely to value what they understand, are adding some historical context, focusing on the early days at the Bureau, to the ongoing discussion of the many probable repercussions of President Trump’s firing of Commissioner Erika McEntarfer last week.
Carroll Wright
The Bureau of Labor Statistics was established in 1884 to study the many issues affecting working men and women. In the words of the first commissioner, Carroll D. Wright, the mission was to conduct “Judicious investigations and the fearless publication of the results.” That was a tall order for a team of three on a $25,000 budget!
Since their founding, the BLS has published more than a thousand monthly employment reports, and this is the first time a commissioner has been fired directly after the release of one of those reports.
There have been accusation of data manipulation, some apparently substantiated, and there is one suspect dismissal that was cloaked as a retirement-age requirement.
Leading into the 1932 election, President Herbert Hoover announced that the Great Depression was almost over, based on the fact that the employment rate had grown by 4% in the previous month. Francis Perkins, who was soon to become President Franklin D. Roosevelt’s Secretary of Labor, pointed out that his statement was inaccurate, the jump was caused by seasonal Christmas hiring, not permanent jobs, something she believed Hoover would have understood on his own. And Ethelbert Stewart, then BLS chief, had told Hoover this.
Ethelbert Stewart
Hoover continued to make the claim, as did his Secretary of Labor, William N. Doak, and the press approached Stewart for his opinion. He was direct in his criticism, which Doak tried to refute, and then gave Stewart a public ” tongue-lashing for daring to contradict his chief.”
Although details of Stewart’s departure from the BLS are somewhat unclear, Time reported under the lede, “Last week the Government’s foremost expert on joblessness found himself jobless,” that although Stewart was supposedly forced into retirement by his age, many disputed that. Stewart himself rejected the term “retired,” adding, “Don’t put it that way. I’ve had a tin can tied to the end of my coat tail.”
In 1971, President Richard M. Nixon ordered the BLS statistician who pointed out that a fall in the unemployment rate from 6.2% to 5.6% was likely caused by a “statistical quirk” be identified, and fired. And in the coming months when the assistant commissioner Harold Goldstein pointed out that one decline in the unemployment rate was “marginally significant,” and another “sort of mixed,” Nixon cancelled the briefings that traditionally followed the release of the monthly jobs report. Rumor has it that Senator William Proxmire, known as a critic of wasteful government spending, requested that the Bureau report directly to the Joint Economic Committee on which he served so they could have discussions free of political spin.
Nixon also believed the BLS included a “Jewish Cabal” out to get him, which led to the “Nixon Jew count,” where H.R. Haldeman supervised an investigation into BLS employees with “Jewish-sounding names.” In what Timothy Noah once described as the “last known act of official anti-Semitism conducted by the United States government,” thirteen employees identified as Jewish were moved into positions that did not involve compiling the politically sensitive employment reports.
It’s easy to think BLS staff, and Dr. McEntarfer herself, were exhibiting the fearlessness Wright was committed to, but releasing and correcting data is just what the BLS does. Years ago, an economist there told us it is indeed painful to release unusually large benchmarks, but “we do it anyway.”
Looking back to the early days of the BLS, there’s a good bit of colorful language. Amid the ongoing debate concerning founding a bureau that concentrated only on the world of work, one senator argued, “A great deal of public attention in and out of Congress has been given to the American hog and the American steer. I submit, Mr. Chairman, that it is time to give more attention to the American man.”
Perhaps that should have been man and woman, and within its first three years the BLS published a study of woman working in “manufactories” in big cities.
Commissioner Wright’s first annual report provided information on the character and potential causes of industrial depressions in a global context.
Here’s a timeline of the development of the many data sets, and we’ve put together some highlights.
Publications in the 1880s included the first consumer expenditure survey, and in the next decade the BLS looked into the effect of tariffs on wages and prices, and investigated the effects of machinery on employment, production and productivity in Hand and Machine Labor.
Later BLS added producer and consumer price indexes, industrial accidents, and in 1915 began their monthly surveys of employment and payrolls, now the Current Employment Statistics program. The first Monthly Labor Review was published that year, and the BLS signed cooperative information agreements with the states the following year.
BLS’s expertise is long-standing. By the 1940s they were training international economists and statisticians, and in 1959 they set up the Household Survey, now officially known as the Current Population Survey. Soon after they conducted comparative studies of international unemployment rates, and of federal and private-sector compensation.
In the 1960s, BLS began recording occupational injuries and illness, and the first job openings reports were produced. The full JOLTS report would be later.
Data on workers with disabilities appeared in 2009, on green jobs in 2012, and that same year BLS Tweeted for the first time!
During the COVID pandemic BLS added questions about job-site respiratory illnesses, and began tracking much-needed data on indigenous populations in 2022. That was long in the making. BLS is now using QCEW data to identify populations facing violent weather events.
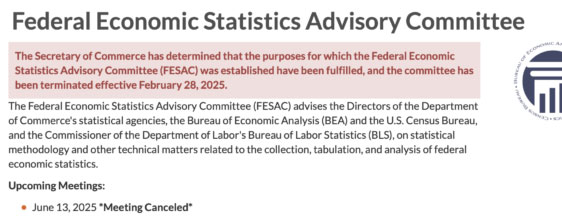
True to their mission of accurate impartial investigations of labor conditions, BLS established the Business Research Advisory Council and the Labor Research Advisory Board in 1947. In 2000 the BLS, together with the Bureau of Economic Analysis, founded the Federal Economic Statistics Advisory Committee, in 2007 the long-standing labor advisory board was renamed the Data Users Advisory Council, and in 2010 the BLS put together the Technical Advisory Committee.
The boards were established to monitor data quality, evaluate BLS methodologies, and suggest improvements. This work was intended to be ongoing — technology changes, and pressure from administrations varies — which made the statement that members had “fulfilled their mission,” as advisors to the BEA were told, downright humorous.
At the time, former BLS Commissioner Erica Groshen commented that given the Committees’ mandate, “I would say that if an administration wanted to try to manipulate data, then they would not want these advisory committees to be around.”
The monthly payroll reports the BLS has published since their founding covered the Great Depression, all manner of lesser recessions, wars, and the effects of inflation spikes. Many of those reports were far worse than the limpid July report that caused Erika McEntarfer to lose her job. President Barack Obama had to accept huge monthly declines, and a -0.9% benchmark revision, multiples of average at the time. President Joe Biden was accused of having cooked the books when the unusually large benchmark revision to 2024 payrolls came out late last August, just two months before the election. (Of course, he was no longer the candidate, but if the BLS were tampering with the records to favor the Democrats, they were doing a lousy job.)
In her history of the BLS, Janet Norwood notes that many of the problems faced in the early days of the BLS are “unresolved to this day.” A major problem then and now is low and late response rates. As early as 1885 a state commissioner argued with appealing candor, “If questions are asked of five hundred men indiscriminately, and two hundred … give answer, those two hundred will not be average representatives of the whole five hundred. They will, on average, have more brains than the other three hundred. The very fact that they answer, while others do not, shows this.”
The revisions that sent President Trump to a place no has ever been before, firing an experienced commissioner because a report was not flattering to the current economy, are caused in large part by such late responses. Response rates have been declining for some time, and former Commissioner Groshen believes some of that decline has been driven by a loss of confidence in public data, and a growing disregard for public research. An inadequate budget also gets a nod. With the BLS’s current, nominal, budget slashed by eight-percent, BLS staff will probably be unable to follow up on particularly pesky sectors, like public education, as they once did.
Bureau of Labor Statistics employees have long argued that with proper funding they could update their data series in order to make them more timely and accurate. For example, the Department of Labor designed the weekly unemployment claims series as an administrative tool, which is why it can sometimes be misleading in gauging unemployment. The series includes a wealth of regional and demographic data that could be restructured as an economic indicator, a kind of early warning system, that would give policy makers notice on developing weakness they could then address, and those who want the 411 on national employment for market reasons would have more timely data as well.
The other is funding an update of the Quarterly Census of Employment and Wages. As we often mention, QCEW covers 97% of the employment universe as defined in the establishment survey, but is released with a lag. We won’t have data for the first quarter of 2025 until early September. And recent budget cuts just pushed that forward from late August.
The decision to cut the BLS budget, and staff, was made by the current administration. When the administration disrupted the carefully crafted structure, including remote work, the BLS had put together to deal with the fact they were moving into a space 40% smaller than the one they had occupied, and budget cuts were announced, many analysts raised red flags suggesting these disruptions could lead to larger revisions in upcoming releases.
Correlation, of course, does not imply causation — we could be seeing big downward revisions because the labor market, driven by all the unknowns and supply disruptions, is weakening more than we knew. That would make the birth/death model too additive, as often happens in downturns, which the BLS took into account during the pandemic, hence the very small benchmarks in 2020 and 2021.
But that possibility doesn’t erase the question. How quickly will the administration’s actions cut into the quality of the BLS’s data, respected around the world as the gold standard, and crucial to our creditors?
* * * About the authors * * *
Philippa Dunne and Doug Henwood are co-editors of The Liscio Report, an independent newsletter geared to traders. The Liscio Report was founded in 1992 by John Liscio, and is known for monthly surveys of state tax data and related forecasts, and independent analysis of macro-economic trends.
Dunne joined The Liscio Report in 1996 to work on special projects, and in 1997 began full-time work as the “research department.” Henwood, a widely recognized economic analyst, caught the attention of John Liscio early on and as the “resident wise man” crunched and analyzed stats from the report’s very first days.
TLR Wire is published weekly by TLRAnalytics with this aim: “No ideology, no agenda, just a straight take on breaking economic data.” You can subscribe here.
—————————
Donate? This site is free and I plan to keep it that way. Some readers have suggested having a way to contribute. I would welcome donations. Any amount, or skip it, your choice. This is completely optional.
Follow Tipswatch on X for updates on daily Treasury auctions and real yield trends (when I am not traveling).
Feel free to post comments or questions below. If it is your first-ever comment, it will have to wait for moderation. After that, your comments will automatically appear. Please stay on topic and avoid political tirades.NOTE: Comment threads can only be three responses deep. If you see that you cannot respond, create a new comment and reference the topic.
David Enna is a financial journalist, not a financial adviser. He is not selling or profiting from any investment discussed. I Bonds and TIPS are not “get rich” investments; they are best used for capital preservation and inflation protection. They can be purchased through the Treasury or other providers without fees, commissions or carrying charges. Please do your own research before investing.


I had already planned on doing what the editor said about selling my I-bonds with 0 or .4% fixed rates…