
By David Enna, Tipswatch.com
U.S. annual inflation continued on a downward trend in August, falling from 2.9% in July to 2.5%, the lowest annual rate in 3 1/2 years.
For the month, seasonally-adjusted inflation rose 0.2%, the Bureau of Labor Statistics reported, which matched expectations. But the annual number was below expectations of 2.6%. Core inflation, which removes food and energy, rose 0.3% for the month (slightly higher than expectations) and held steady at 3.2% for the year.

Once again, shelter costs were the trouble-maker in this inflation report. The index for shelter rose 0.5% in August and was up 5.2% year-over-year. The BLS called shelter “the main factor” in the increase in all-items inflation. Also in the report:
- Gasoline prices fell 0.6% for the month and are down 10.3% year-over-year.
- The costs of food at home increased just 0.1% and are up 2.1% for the year.
- Apparel costs rose 0.3% and were also up 0.3% for the year.
- The costs of medical care services fell 0.1% for the month but are up 3.2% for the year.
- Costs of used cars and trucks fell 1.0% (the third monthly decline in a row) and are down 10.4% for the year.
- Costs of new vehicles held steady and are down 1.2% for the year.
- Motor vehicle insurance costs increased 0.6% for the month and are up a lofty 16.5% over the last year.
- Airline fares rose 3.9% for the month, after declining five months in a row.
So this report, overall, shows a positive trend of declining U.S. inflation, with the annual rate dropping to its lowest level since February 2021. Inflation watchers know that 2.5% for CPI-U is entering a normal historical range. Here is the trend in U.S. inflation over the last 12 months, showing the sharp decline in all-items inflation, despite lingering high costs of shelter:

What this means for TIPS and I Bonds
Investors in Treasury Inflation-Protected Securities and U.S. Series I Bonds are also interested in non-seasonally adjusted inflation, which is used to adjust principal balances on TIPS and set future interest rates for I Bonds. For August, the BLS set the CPI-U inflation index at 314.796, an increase of 0.08% over the July number.
For TIPS. Today’s report means that principal balances for all TIPS will increase 0.08% in October, after rising 0.12% in September. Here are the new October Inflation Indexes for all TIPS.
For I Bonds. The August inflation report is the fifth of a six-month string that will determine the I Bond’s new variable rate, which will be reset on November 1 and eventually roll into effect for all I Bonds. After five months, inflation has increased 0.79%, which would translate to a variable rate of 1.58%, down from the current 2.96%.
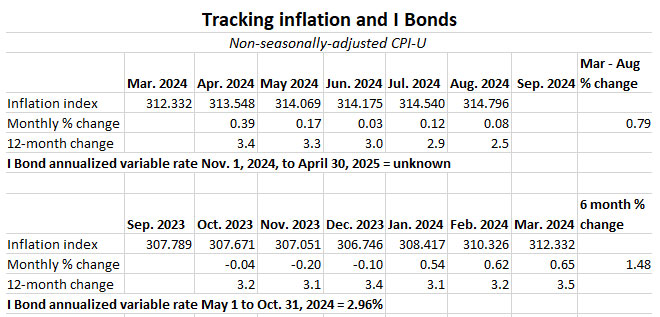
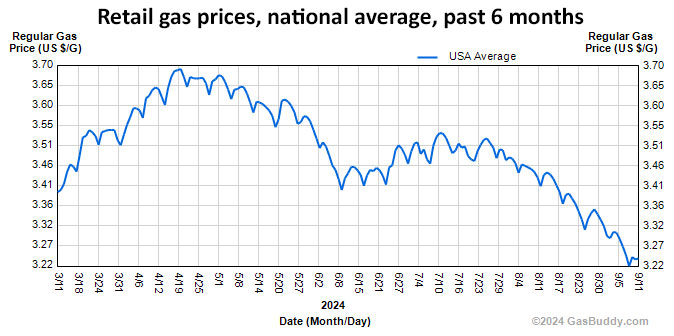
One month remains, so we could be looking at a variable rate in the range of 1.78% to 1.98%, which would disappoint I Bond investors. But that’s the trend in inflation over the last half year. And September’s rate is not likely to bump higher, given the current trend in gasoline prices:
I Bonds, in my opinion, remain attractive with the current fixed rate of 1.3%, which remains in place for the potential 30 years to maturity. But older I Bonds with fixed rates of 0.0% to 0.2% are likely to deliver weak returns for six months.
What this means for Social Security COLA
The Social Security Administration uses a different inflation index — CPI-W — to determine the next year’s cost-of-living-adjustment. And it looks only at the average of three months of data, from July to September, compared with the average for the same three months of the previous year. For August 2024, the BLS set the CPI-W index at 308.640, an increase of 2.4% over the last year.
Here is the current trend, with a COLA of 2.4% looking increasingly likely:

What this means for future interest rates
The August inflation report is good news for the Federal Reserve, even though shelter costs remain a nagging sore point and monthly core inflation was a tick higher than expectations. Annual CPI-U has fallen to 2.5%, and the Fed’s preferred index, Personal Consumption Expenditures, is also trending lower.
The Fed’s Open Market Committee will meet next week and we can be nearly 100% certain that meeting will result in a cut in short-term interest rates. I would guess 25 basis points, because I believe the Fed will want to act cautiously. There is little evidence that the U.S. economy, while slowing, is heading toward a steep decline.
This morning’s Wall Street Journal report includes the subhead: “CPI data tees up Fed to begin gradually cutting rates next week.” That’s on target.
• Confused by I Bonds? Read my Q&A on I Bonds
• Let’s ‘try’ to clarify how an I Bond’s interest is calculated
• Inflation and I Bonds: Track the variable rate changes
• I Bonds: Here’s a simple way to track current value
• I Bond Manifesto: How this investment can work as an emergency fund
—————————-
• Now is an ideal time to build a TIPS ladder
• Confused by TIPS? Read my Q&A on TIPS
• TIPS in depth: Understand the language
• TIPS on the secondary market: Things to consider
• TIPS investor: Don’t over-think the threat of deflation
• Upcoming schedule of TIPS auctions
* * *
Follow Tipswatch on X (Twitter) for updates on daily Treasury auctions and real yield trends (when I am not traveling).
Feel free to post comments or questions below. If it is your first-ever comment, it will have to wait for moderation. After that, your comments will automatically appear. Please stay on topic and avoid political tirades. NOTE: Comment threads can only be three responses deep or the display breaks on the mobile site. If you see that you cannot respond, create a new comment and reference the topic.
David Enna is a financial journalist, not a financial adviser. He is not selling or profiting from any investment discussed. I Bonds and TIPS are not “get rich” investments; they are best used for capital preservation and inflation protection. They can be purchased through the Treasury or other providers without fees, commissions or carrying charges. Please do your own research before investing.

I have three I-Bonds in my ladder from early 2023 that have a 0.40% fixed rate that I am considering redeeming and then reinvesting at the current 1.3% rate. Any rule of thumb suggestions on the degree of spread and when it’s prudent to swap them out, anyone?
If these were $10,000 each and issued in Jan 2023, your current principal balance is $10,828 for each, but the 3-month interest penalty would bring that down to $10,732, so you’d owe federal taxes on $732 x 3 = $2,196. That’s the equation to consider. I am assuming you have no other I Bonds with fixed rates less than 0.4%?
I am considering the same strategy for an October gift box purchase. While I hadn’t planned to redeem my 2023 I Bonds early, I’m thinking this could be the highest fixed rate we see for a while.
This video by Jennifer Lammer explains how to calculate the breakeven point if you swap I Bonds less than 5 years old for a higher fixed rate (note, however, it does not factor in the immediate tax hit or the interest lost through compounding).
The breakeven point depends on the amount of the interest penalty and the difference in fixed rate. Redeeming early was a no-brainer for 0% fixed rate bonds. For 0.4% fixed rate I Bonds, it will take longer to recoup the interest penalty. However, the swap could still be worthwhile if you are planning to hold the higher fixed rate bonds for at least 5 years.
To calculate the breakeven point, divide the early withdrawal penalty by the amount of additional annual interest earned with the higher fixed rate (in this case $90 per $10,000 of I Bonds), then multiply the result by 12.
I am considering waiting until January 1 – three months into the lower 3.37% composite rate – to redeem my 0.4% fixed rate I Bonds, when the early redemption penalty is $92. Using Jennifer’s formula, it would take about 12 months for my upcoming October I Bond purchase to regain the interest lost on my April 2023 I Bond redemption (92/90*12 = 12.3).
If you’re redeeming early 2023 I Bonds that are still earning the 4.35% composite rate, the penalty will be higher ($112) and it will take about 15 months to make up the lost interest for early redemption (112/90*12 = 14.9).
Any update on real rates? It is looking like the 11/1 fixed I bond rate will stay at 1.30% or go down?
At this point, I am thinking the rate will be 1.2% or 1.3%, and 1.2% will be more likely if real yields keep falling. The big question: Will the Treasury be swayed by the big recent drop in real yields, which were much higher in May? A rate at or above 1.0% should be a sure thing. But …
The fixed rate staying at 1.3% looks increasingly unlikely, unless the Treasury decides to be generous. If current trends continue, the April-Oct average of the 5-year real yield will be around 1.8%. That should translate to a new I Bond fixed rate of 1.2% (or possibly lower). I’m therefore considering doing a gift box purchase before the end of October.
As an I-Bond investor who is also a taxpayer, I sure hope Treasury never “decides to be generous.” Raising the fixed rate 1/10 of a point because they think that can still save them a basis point or two vs. their modeled cost of regular T-Bonds/Bills over the average holding period of I-Bonds is one thing: paying more just to be nice to me and people like me is another.
It is highly unlikely the Treasury will try to be “generous,” but keep in mind that an I Bond carries a real yield lower than an equivalent TIPS and also is issued in much smaller amounts. So I Bonds are a fair deal for the Treasury.
How do you see the upcoming 2024 TIPS offerings?
I will be posting a preview article Sunday morning. Right now the real yield for that TIPS is trading at 1.61%, down substantially from a few months ago. But probably still attractive enough to consider.
Core inflation rose .3% last month, or annualized around 3.6%. Seems a lot higher than the Fed’s 2% target, almost twice as high. If the Fed starts the “cutting rates” process next month, it will stoke inflation, again. That is okay with me, although it seems like they should have learned their lesson by now. I can take a hit on 3-month T-bill interest for a time, knowing that rates will increase again as the Fed stimulates an already solid economy, leading to more inflation. As for the election, Trump tariffs or the Democrats’ spend-spend-spend policies will also lead to more inflation.
I agree that in the longer-term, inflation may not be tamed. But if all-items inflation is running at 2.5%, it does make sense to lower the federal funds rate down from an effective rate of 5.3%. If inflation remains calm, the Fed can lower 100 to 150 basis points. But if the economy dives, rate reductions will be faster and deeper.
Thank you for the update. I always enjoy your articles and information. I see no confusion with how the SS COLA is calculated. You even provided a very nice table to show the numbers. I will be applying for Medicare this month. Holding off on claiming SS until I am 70. I knew basically nothing about TIPs up until I found this site about a year ago. As you grow older the impact of inflation on your money starts to come to your awareness. I have saved plenty and am still working part time as a Tax CPA in my own business but this is all new to me. Please keep up the good work!
In every article that discusses the Social Security COLA you highlight the use of the Jul-Sep average of CPI-W that is used in the calculation. But I think your wording can cause confusion or a misconception. You say, “it looks only at the average of three months of data” — which implies that the COLA is determined by annualizing the average of only three months of data. And that is not correct.
The COLA is determined by comparing the 3rd Quarter this year to the 3rd Quarter last year. It is equivalent to 3 annual rates (Jul-Jul; Aug-Aug; and Sep-Sep) that are averaged together. The formula looks at 3 series of 12 months of data. It does not look “only at the average of three months of data.”
We are probably getting into semantics here, but the COLA is determined by averaging three specific data points: CPI-W for July, August and September, and comparing that average against the same average from the year before. There is no annualizing going on, except to compare the 2024 average versus the 2023 average. For example, for 2023 the three data points were: 299.899, 301.551 and 302.257. The total was 903.707 and the average was 301.236, which was 3.2% higher than the 2022 average, and the COLA was set at 3.2%.
It might be semantics, but that might be hard to determine in exchanging comments. So I would begin by asking what you think a better formula would be (assuming the use of CPI-W).
These following 2 formulas produce the same result (mathematically) as that used by the SSA.
The formulas compare something from this year to the same something last year. It uses a whole years worth of data; not “only three months”. Specifically it uses a whole years worth of data from three consecutive months and averages them.
When you calculate and describe annual inflation every month you don’t say that it’s looking at only 1 month of data. Because it’s not. It’s looking at something from this year and comparing it to the same something from last year. The same is true of the SSA COLA.
Yes, this link: https://www.ssa.gov/OACT/COLA/latestCOLA.html demonstrates the exact formula the SSA uses, and it is the one I use. The SSA says this about last year’s increase: “The average CPI-W for the third quarter of 2023 is 301.236. Because this average exceeds 291.901 by 3.2 percent, the COLA effective for December 2023 is 3.2 percent.” Three months, three numbers, averaged and then compared with the same average from a year earlier. If your formula works, that’s fine. But the exact formula the SSA uses is the one presented on that page.
My comment was not about the SSA formula you used.
My comment is about your use of the phrase “only at the average of three months of data”. That characterizes the formula as looking at only 3 months of data –that it’s leaving something out. The message is that how can this COLA be meaningful if it’s only looking at 3 months of data.
I infer from your SSA COLA articles that you don’t like the formal in general, but the main inference I develop is that you believe it does not represent a change that considers a whole years worth of data.
The SSA formula represents a measure of an annual change that considers 12 months of data. It just does it three times and then uses the average of those 3 measures.
Tim, would this work:
The formula compares the “average CPI for Jul Aug Sept” to the “average CPI for Jul Aug Sept” from the prior year.
This is very similar to what this article says. I read the word “only” in that sentence as “the formula does not take into account what happens in Jan through Jun or in Oct-Dec. (Crazy example – CPI doubles in Jan, then return to more reasonable level in Feb – the crazy increase is never taken into account).
By the way, that formula never compares Sept to Sept and so on, only the three months average to prior year three month average.
Why not average the whole 12 months to 12 months – I have no idea.
I’m glad you wrote that second paragraph, because that is the point I was trying to make. The formula *does* take into account what happens in Jan-Jun and Oct/Dec.
The monthly CPI numbers are cumulative (or maybe a better word is compounded). That’s what makes them useful to make comparisons. As long as a monthly number after your crazy Jan is compared to a monthly number before your crazy Jan — that crazy jump is accounted for.
When Jul 2024 is compared to Jul 2023 the result is the annual change and considers everything that happened in that 12 month period (1 year). When the average of Jul/Aug/Sep 2024 is compared to the average of Jul/Aug/Sep 2023 the result is an annual change and considers everything that happened in that 4 quarter period (1 year).
I offered the alternative POV into the calculation which is mathematically (algebraically) equal to the description the SSA uses as a way to demonstrate that 1 years worth of data is used to calculate the COLA. One looks at the annual change from Jul-Jul, and the annual change from Aug-Aug, and the annual change from Sep-Sep — take the average of those 3 annual changes and you will have the COLA.
Mathematically it does not matter if I take the average before the comparison or after. The SSA formula (average before) is meant as a proxy for the 3rd Quarter CPI-W (as quarterly CPI numbers don’t really exist). So they are describing a 3rd Quarter to 3rd Quarter annual change which accounts for everything that happened between those quarters
The key point is that CPI-W inflation through June sets a baseline for the next year’s Social Security COLA. But from that point, the SSA formula relies on combining CPI-W inflation indexes for July, August and September and averaging them, then comparing that number with the same average for the year before. That is the SSA’s formula.
I am obviously not communicating well. June does not set the baseline. The baseline was set in the Jul/Aug/Sep numbers from the prior year which are then compared against the Jul/Aug/Sep numbers from this year.
In the sense that the CPI-W, like all CPI indexes, are compound, then Jun is important because you cannot get the Jul index without first getting the Jun index. (and you cannot get the Jun index without first getting the May index … )
You are absolutely performing the calculation 100% as described by the SSA. I just think your characterization of that calculation implies exactly what your comment above just said — that we begin in Jun, look at 3 months of data, and come up with some COLA that only looks at 3 months of data (to the exclusion of 9 months of data).
The characterization is we begin from the Jul/Aug/Sep CPI-W average from the previous period which is built-up month by month until the current Jul/Aug/Sep period. From those two 3-month averages, an annual change is calculated that looks at 12 full months of data (3 times).
I appreciate your patience while I tried to make my point. I just think your otherwise excellent blog misses the point in your description of the SSA COLA calculation and can lead people to believe that 9 months of data is excluded in the determination of the COLA.
The June index is the baseline because, as you note, it contains all the inflation activity of the last 9 months. Then the SSA looks at the next three months of data, averages those indexes, and compares it to the 3rd-quarter average from the year before. We are saying the same thing, in different ways.