
CUSIP 912828N71 continued the trend of strong performance.
By David Enna, Tipswatch.com
Back on Jan. 21, 2016, we had a “sort-of” exciting moment in the market for Treasury Inflation-Protected Securities. The Treasury auctioned a new 10-year TIPS — CUSIP 912828N71 — which generated a real yield to maturity of 0.725%, the highest yield for any 9- to 10-year TIPS auction for nearly five years.
That real yield seems mundane today, but it was a big improvement over a stretch of very low and often negative real yields dating back to September 2011.
Inflation breakeven rate. Another interesting aspect of this TIPS is that on the auction date the 10-year nominal Treasury note was yielding just 2.03%, creating an ultra-low inflation breakeven rate of 1.30%.
Let me ask: Do you think inflation averaged more than 1.3% over the last 10 years? The answer, of course, is yes. Inflation averaged 3.2% over the next 10 years, making this TIPS an outstanding investment versus the 10-year nominal bond of the time.
The final investment results for this TIPS were set by the “iffy” November inflation report released Dec. 18, which may have slightly under-reported true inflation because of problems with government data collection. We will never know for sure. Here is how CUSIP 912828N71 performed at the end:
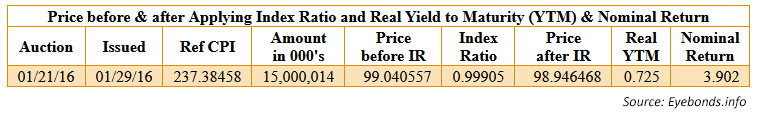
Data from Eyebonds.info show this TIPS generated a 10-year nominal annual return of 3.902%, easily exceeding the comparable nominal Treasury at 2.03%. For its time, CUSIP 912828N71 was a very good investment.
TIPS versus an I Bond
An I Bond issued in January 2016 had a fixed rate of 0.10%, well below the real yield of this TIPS at 0.725%. According to Eyebonds.info, from January 2016 to the end of June 2026, the I Bond will have generated a nominal return of 3.16%. That is better than the Treasury note at 2.03%, but lags the return of the TIPS at 3.902%.
TIPS versus other alternatives
The total bond market, defined by Vanguard’s Total Bond ETF (BND), has had an average total annual return of 1.94% over the last 10 years, trailing both the January 2016 I Bond and CUSIP 912828N71.
The TIP ETF, which holds all maturities of TIPS, has had an average total return of 2.86% over the 10 years. VTIP, the short-term TIPS ETF, had an average return of 3.15%.
So, when compared to safe alternative investments, CUSIP 912828N71 had the best performance.
One more thing: CUSIP 912810FS2
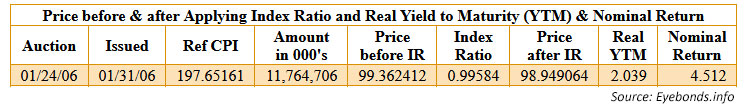
Another TIPS is maturing Jan. 15: CUSIP 912810FS2, a 20-year TIPS that was originally auctioned on Jan 24, 2006. I don’t track the old 20-year maturities because the Treasury stopped issuing them in November 2009. This TIPS was attractive, with a real yield to maturity of 2.039% at the originating auction.
At the time, a 20-year Treasury bond was yielding 4.63%, giving this TIPS an inflation breakeven rate of 2.59%. Over the last 20 years, annual inflation has averaged 2.51%, and this TIPS will end up providing a nominal return of 4.512%, slightly below the nominal Treasury.
Verdict: CUSIP 912810FS2 was a slight loser versus the nominal Treasury. This happened because inflation ran at lower-than-predicted levels much of the time through 2020.
Thoughts
There is an obvious lesson here: TIPS do well when inflation is higher than expected, and that is exactly why we invest in TIPS — to protect against that possibility. When compared to similar investments, buying this 10-year TIPS in January 2016 and holding to maturity was a sound move.
I purchased this TIPS in a taxable account at TreasuryDirect with a small investment at the January 2016 auction. I get my payday on January 15.
TIPS have been on a winning streak for several years, caused by the surge to 40-year high inflation that peaked in June 2022 at 9.1%. Even today, annual inflation (2.7%) is running higher than the auctioned breakeven rate of January 2016. And so TIPS have been the winners versus nominal Treasurys in recent years.
Notes and qualifications
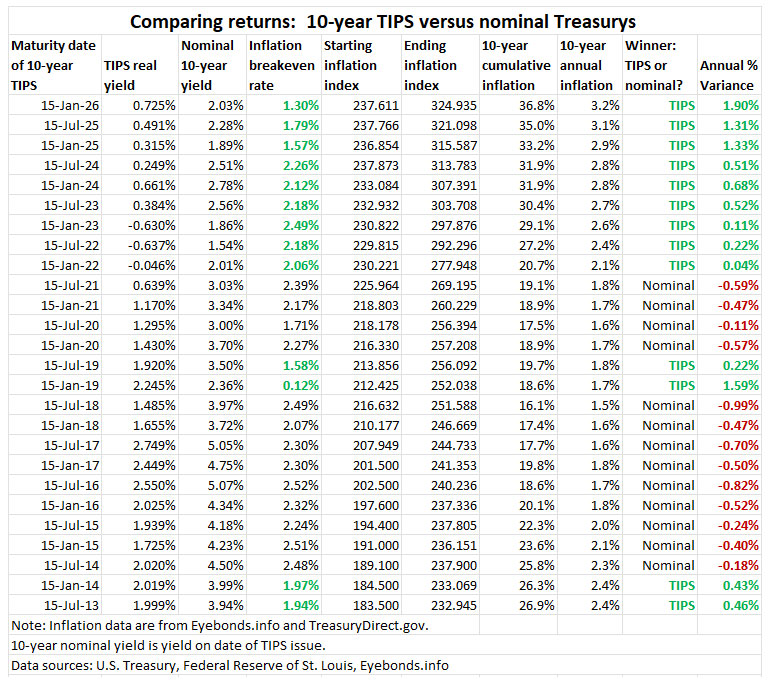
My chart is an estimate of performance comparing inflation breakeven rates versus actual inflation.
Keep in mind that interest on a nominal Treasury and the TIPS coupon rate is paid out as current-year income and not reinvested. So in the case of a nominal Treasury, the interest earned could be reinvested elsewhere, which would potentially boost the gain. For certain, we don’t know what the investor could have earned precisely on an investment after re-investments.
In the case of a TIPS, the inflation adjustment compounds over time, and that will give TIPS a slight boost in return that isn’t reflected in the “average inflation” numbers presented in the chart.
• Confused by TIPS? Read my Q&A on TIPS
• TIPS in depth: Understand the language
• TIPS on the secondary market: Things to consider
• TIPS investor: Don’t over-think the threat of deflation
• Upcoming schedule of TIPS auctions
—————————

Donate? This site is free and I plan to keep it that way. Some readers have suggested having a way to contribute. I would welcome donations. Any amount, or skip it, your choice. This is completely optional.
—————————
Follow Tipswatch on X for updates on daily Treasury auctions and real yield trends (when I am not traveling).
Feel free to post comments or questions below. If it is your first-ever comment, it will have to wait for moderation. After that, your comments will automatically appear. Please stay on topic and avoid political tirades. NOTE: Comment threads can only be three responses deep. If you see that you cannot respond, create a new comment and reference the topic.
David Enna is a financial journalist, not a financial adviser. He is not selling or profiting from any investment discussed. I Bonds and TIPS are not “get rich” investments; they are best used for capital preservation and inflation protection. They can be purchased through the Treasury or other providers without fees, commissions or carrying charges. Please do your own research before investing.

I think the comment by “clearlyc1655a3a91
says:
January 18, 2026 at 10:37 pm” is on to something for the dreaded cliff of the I-Bonds interest in 2030.
The way I understand it, if one spouse transfers the bond to the other spouse, the accumulated interest would be due in that tax year. And when the bonds mature there would be less interest accumulated for the new owner. True, if you file taxes jointly you would still be paying the interest on the bond with your spouse, BUT you would be splitting the interest over several years.
Thanks Doug, I think that makes sense, but a complicated way to do it. On the positive side, you retain the great interest rate until maturity. (I am not a tax expert.)
Hi David, I tried sending this question a week or so ago, but it may have gotten lost in the mail. My apologies if you’ve already answered and i missed it.
I’m going to try transferring a portion of the 1998-2001 I-Bonds from my Treasury Direct account to my wife’s Treasury Direct account and creating a taxable event this year and next year in order to spread the taxable interest over two additional years. My wife is also planning to transfer some of the I-Bonds in her account to my account for the same reason. I have read that 1099-INT’s will be generated for the accumulated interest up until the transfers. We are co-owners and we file married filing jointly income tax returns. On two calls to (844) 284-27676 Treasury Retail Security Services, the specialists said this is not a taxable event. On the third call, the specialist said this is a taxable event. I’ve read one or two places that my plan will work the way I hope it does. Can you give me your thoughts about this? Thanks.
I bonds purchased during that period have been a great investment but will unfortunately creat a huge federal tax bomb when they mature in a few years. I face the same situation. Nice problem to have!
Correct me if I’m wrong, but I-Bonds have a final maturity of 30 years, not 10.
You are also not required to redeem them even at 30 years – most people would since they’re no longer earning interest, but if it’s a genuine “tax bomb” and the numbers line up there’s no reason you can’t spread those final redemptions over several years of income.
No I Bond has yet matured, but IRS regulations do state “technically” that interest is due on savings bond interest at maturity. I doubt that is enforced for minimal amounts, but for large payouts like the 30-year I Bonds, it could be. Also, electronic I Bonds are automatically paid out at maturity and taxes are due on interest. That includes converted paper I Bonds.
I did respond to your question for the comment you posted in this article.
My answer was: I am not a tax expert, so I have no idea of an answer. I would suspect that if you file a joint return, all proceeds would be taxed together in that one return. Could you simply redeem one third in 2026, one third in 2027 and one third in 2028? My wife and I have a large allocation maturing in 2031 and we will redeem them over five years, beginning next year. Read this if you haven’t seen it: https://tipswatch.com/2024/02/04/long-time-i-bond-investors-face-a-tax-time-bomb/
Thanks for the reference back to the previous article. My bonds mature in 2030 and 2033. I will start RMD’s in 2030. Gosh I hate to redeem those 2030’s early because the rate is great, but I need to consider it.
The advantage of transferring them to either my daughter or my wife rather than redeeming them is that we can continue earning ~6.3% for a couple more years. The treasury Direct website seems to address this and doesn’t say anything about not being able to transfer them to your spouse and including the interest on your joint return.
Changing information about EE or I savings bonds (reissuing) — TreasuryDirect
Will I have to pay taxes when you reissue the bond?
You are the original owner. We reissued it to someone else. You no longer own it. If you have not been paying tax on the bond’s interest every year, you now owe tax on all the interest the bond earned while you owned it. You will not owe tax on interest the bond earns for the new owner.
You are the new owner. You will in the future owe tax on interest the bond earns from the time you became the owner. You do not owe tax on interest the bond earned before you owned it.
Daughter, yes. But could you trigger the gift tax? If you file a joint return with your wife, I don’t see the benefit. You’ll owe the same taxes.
Mina, you don’t have to redeem an I-Bond at it’s 30-year maturity, but as David indicated, you are required to pay the taxes in the year of maturity even if you don’t redeem them. The law is that you would be subject to an under-payment penalty for not paying taxes in the year that they are due.
That situation would only apply to a paper bond since, again as David said, Treasury Direct redeems electronic bonds automatically.
My last 2025 income investment was 50% in a 5 year TIPS and 50% in a 5 year CD yielding 3.8%. I have no idea which will do better when they mature in 2030. But with two trillion dollar a year deficits seemingly baked into our political system for at least a few more years, I think the odds favor TIPS.
I might also mention EE bonds, which nobody talks about anymore. Had you bought EE bonds (up to a limit of $10,000) in January 2016, they would have an imputed annualized yield of 3.5% although to capture this return you have to wait another 10 years until January 2036 to redeem them at the 20 year mark. EE bonds holders, like I bonds, averted the bond market disaster of 2022.
Love these reviews. Gives you a great understanding of what TIPS are all about and makes me feel better about all the individual TIPS I purchased and will hold to maturity.
It appears that buying TIPS outright, and holding till maturity, the returns will beat the returns of TIPS ETF’s all the time.
A lot of the time I should say.
The TIP ETF can out-perform in the short-term (sometimes several years) when real yields fall dramatically, as happened during Federal Reserve QE interventions in 2020 (up 10.8%) and 2011 (13.3%). I’m not a fan of trying to time those moves, but anytime the Fed announces a period of aggressive quantitative easing, the TIP ETF will probably do well.
This TIPS protected against inflation, as you stated as it was designed to do, but no one who bought it ten years ago did so because they anticipated a once in a century pandemic and supply chain issues resulting from a reopening of the economy after vaccine distribution half way through the term would occur to spike inflation to over 9%. Without Covid, it would have been a totally different investment just like so much in our society would’ve been different. I guess you can say TIPS (and I bonds) protect against inflation for any reason, but it seems to me this period that includes 2020-2022 is such an outlier that it is impossible to draw any conclusion during “normal” times (which there probably is no such thing, I will admit).
The point is that TIPS and I Bonds protect against “unexpectedly high inflation.” That is exactly what we got from April 2021 to July 2024. So these investments did the job they were designed to do. And certainly more outlier events can be in our future.
I obviously respect your expertise in this area, but just to push back a little for the sake of banter, inflation was 3.4% in 2023 (around average) and 2.9% in 2024 (below average) so it was really the 2021-2022 pandemic reopening and supply chain constraint period with inflation at 7% and 6.5% respectively that spiked everything. The last time annual inflation rates were that high was the 1977-1981 period. That’s a 40 year gap (half a lifetime) between the two peak inflation periods. I’d call them outliers (which, yes, can happen again). I’d be curious to see data that excludes these anomalies to gauge TIPS and I Bonds as an investment in “normal” times (which I’m sure you’ve documented along the way). You’re right to point out the data, but I think it needs an asterisk.
Marce, let’s say inflation had averaged 2.5% over those 10 years, which we could consider “average.” This TIPS still would have out-performed the nominal Treasury by a large margin, 120 basis points a year. That happens simply because the starting inflation breakeven rate was so low, at 1.30%. The worst average inflation for any 10-year period since 1971 has been 1.6% for the 10 years ending in 2017.
The performance of this TIPS is an outlier, for sure, but a big factor was the very low inflation expectations of 2016. Today’s 10-year inflation breakeven rate is 2.27%, which might still be “low” but maybe not extremely off base. I’d still prefer the TIPS to protect against an inflation surprise.
There was a 40 year gap in significant inflation but the difference is now there is a $38 trillion deficit, an unspoken surrender by the US government on the deficit issue, the slow decline of the US and West and the rise of the BRICS countries all coalescing to make future inflation more of a possibility.
I view TIPs as insurance–in this case insurance against unexpected inflation. I don’t have them as part of my portfolio because I expected a once in a lifetime event affecting the economy (like covid, but it could be anything), but I also don’t buy auto insurance because I “expect” to have an accident. I just know that stuff happens and I want to be reasonably prepared.
Even though I own TIPs, I actually hope they don’t out-perform nominal bonds, just like I hope I never need to use my insurance. Low inflation is fine with me!
FWIW, TIPs and make up about 15% of my overall portfolio and about 25% of my overall bond portfolio.
With respect to CUSIP 912810FS2, a slightly lower return than the nominal doesn’t seem so bad to me for those 20 years. Do you have a sense of where that result falls within the range of past outcomes for TIPS? The upside of TIPS during periods of high inflation seems obvious, so I am wondering what the distribution of break even shortfalls have looked like over the years, as well as what percentage of all TIPS results have fallen into that side of the distribution.
You can look at the chart to see how 10-year TIPS have performed for maturities over the last 13 years. Some years TIPS under-performed because inflation was quite low and in recent years have out-performed because of the surge in inflation in recent years.
You can also see how 5-year TIPS have performed on my TIPS vs. Nominals page.
Doh! Thanks for the link to the 5 year chart. I calculated the median break even as +.07% for the 5 year chart and -.15% for the 10 year. The downside range on the 10 year is much higher than on the 5 year (perhaps not surprisingly), but overall my impression is that the charts show that TIPS have provided unexpected inflation insurance in exchange for a relatively small amount of downside in possible returns.