
For the first time since December 2008, the Federal Reserve is raising its Federal Funds Rate from zero to a range of 0.25% to 0.50%. If you like, you can read the Fed’s press release detailing its thoughts on the move, which was extremely well telegraphed.
Here is the key paragraph:
The Committee judges that there has been considerable improvement in labor market conditions this year, and it is reasonably confident that inflation will rise, over the medium term, to its 2 percent objective. Given the economic outlook, and recognizing the time it takes for policy actions to affect future economic outcomes, the Committee decided to raise the target range for the federal funds rate to 1/4 to 1/2 percent. The stance of monetary policy remains accommodative after this increase, thereby supporting further improvement in labor market conditions and a return to 2 percent inflation.
In other words, the Fed knows that a base short-term interest rate of 0.25% remains well below the likely rate of inflation in the coming year. And this remains a time of ‘easy money,’ which can continue to spur economic growth.
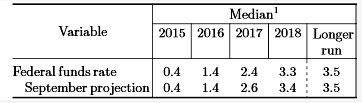 The Fed also released a chart of projections for the economy and the Federal Funds Rate. It sees inflation rising to 1.6% in 2016, 1.9% in 2017 and 2.0% in 2018 and beyond. And it projects the Federal Funds Rate climbing to 1.4% in 2016, 2.6% in 2017 and 3.3% in 2017. As you can see from the chart, those numbers are slightly lower than the Fed was projecting in September. In actuality, the Fed is saying it expects a ‘normalized’ short-term interest rate of 3.5% when inflation is 2.0% in 2018 and beyond. It’ll take several years – and a steady economy – to see if that is true.
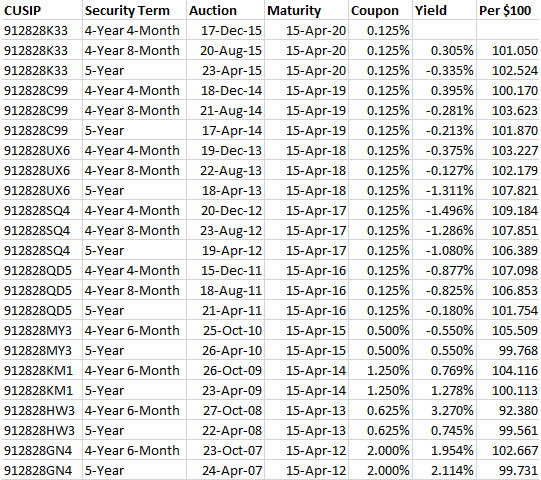
Back in April 2014, I wrote a blog theorizing on where yields for Treasury Inflation-Protected Securities would be heading when the Fed began raising its short-term rate. At the time, I speculated that the rate would rise gradually to 2.5%, which is where the Fed is now projecting it will be in 2017. Here is what I found:
 I am going to toss out the high and low numbers in each column, and say that in 2017:
- A 5-year TIPS could be yielding in a range of 0.79% to 0.97%.
- A 10-year TIPS could be yielding in a range of 1.49% to 1.74%.
- No data for 30-year TIPS, so no prediction.
However, one caution: This assumes the Fed will carry out future rate increases. That is certainly not a sure thing.
Checking in on Thursday’s 5-year TIPS reopening
This is a reopening of CUSIP 912828K33, creating a 4-year, 4-month TIPS with a coupon rate of 0.125%, plus inflation.
I am working Thursday morning and I won’t be able to post then, so here we go. If I were buying at this auction – and I definitely might be – I’d want to check these numbers in the morning, because things could be volatile. Non-competitive bids must be placed by noon; the auction closes at 1 p.m.
- Bloomberg’s Current Yields page shows this TIPS trading with a yield of 0.50% and a price of $98.37 per $100 of value. (It is going at a discount because the yield is higher than the coupon rate.)
- The Wall Street Journal’s Closing Prices page shows this TIPS – which matures in April 2020 – closed Wednesday with a yield of 0.46% and a price around $98.50.
- The Treasury’s Real Yields Curve page estimates that a full-term 5-year TIPS would have yielded 0.55% at the close today. (The yield on a full-term 5-year should be slightly higher than that of a 4-year, 4-month TIPS.)
Thursday morning, check those links and also track the price of the TIP ETF, which closed today at $109.15. If you see the price dropping, that means yields are rising. If the price is rising, yields are dropping.
If this auction generates a yield of 0.4%, it would be highest yield for any 4- to 5-year TIPS at auction since April 2010 – more than five years.
Also, keep in mind that this TIPS will have an inflation index of 1.01563 on the settlement date of Dec. 31. That means buyers will be purchasing about 1.5% of additional principal.
If all stays the same, tomorrow’s auction should net a yield of about 0.48%, which I would consider very attractive. The nominal 5-year Treasury is yielding 1.75%, creating an ultra-low inflation breakeven rate of 1.27%, well below the Fed’s projections. As you can see from this chart of the 5-year breakeven since 2007, this is rare territory:


You said, "If you are selling before the 5 year period, the best month to sell can often be in…