

By David Enna, Tipswatch.com
I sometimes watch too much CNN (stop me!) and on Thursday I heard Republican members of Congress repeatedly state that the just-approved Big Beautiful Bill would eliminate the tax on Social Security benefits, fulfilling a campaign promise by President Trump.
And then in his celebratory speech in Iowa Thursday evening, Trump said:
“We’re making the Trump tax cuts permanent and delivering no tax on tips. No tax on overtime. And no tax on Social Security for our great seniors. Right?”
And I received this email from the Social Security Administration Friday morning:
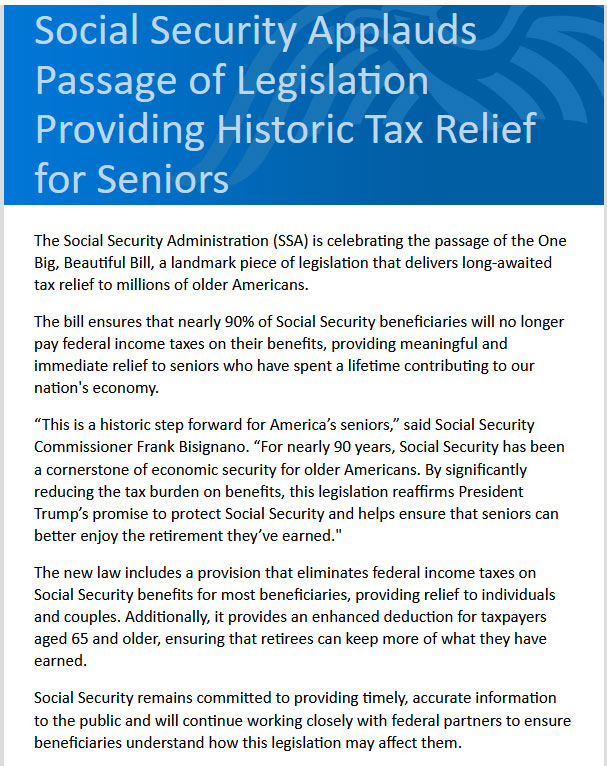
The Social Security Administration (SSA) is celebrating the passage of the One Big, Beautiful Bill, a landmark piece of legislation that delivers long-awaited tax relief to millions of older Americans.
The bill ensures that nearly 90% of Social Security beneficiaries will no longer pay federal income taxes on their benefits, providing meaningful and immediate relief to seniors who have spent a lifetime contributing to our nation’s economy. …
The new law includes a provision that eliminates federal income taxes on Social Security benefits for most beneficiaries, providing relief to individuals and couples. … Social Security remains committed to providing timely, accurate information to the public.
A lot of this is not true, and whoever was responsible for that email should be embarrassed. What’s even weirder: There was no reason to fudge the facts here. The bill does provide meaningful (but temporary) tax relief for most seniors, and in fact will reduce federal tax bills for most seniors. But it does not eliminate the tax on Social Security benefits, which remains intact exactly as in pre-July-4 law.
What the bill does
The Big Beautiful Bill provides a $6,000 boost to senior citizens’ standard deduction from 2025 through 2028. The new tax break — $6,000 for individuals and $12,000 for couples — is for tax filers age 65 and older. It starts phasing out for those who earn over $75,000 ($150,000 for couples).
This provision is aimed at middle- to upper-middle-income taxpayers. People with very low incomes won’t benefit (they already pay near-zero taxes) and high-income people will see the deduction phased out completely. This is from a Yahoo Finance analysis:
To be clear, this provision does not eliminate taxes on Social Security benefits as Trump promised in the campaign. It is a temporary income tax deduction, not a cut in the Social Security tax. …
In addition, under existing law, people over 65 got an add-on to the standard deduction — $2,000 for a single person and $3,200 for a couple filing jointly. The White House has issued a fact sheet that clarifies those pre-existing add-on deductions will continue:

Under current law, about 40% of people who get Social Security must pay federal income taxes on some of their benefits, according to the SSA. The tax hit begins at low levels ($32,000 for couples) and eventually caps out at $44,000, when up to 85% of the couple’s benefits may be taxable. These levels were initially set in 1983 and have not been indexed to inflation.
Again, the current tax on Social Security benefits remains intact. But the boost of $6,000 / $12,000 to the standard deduction will provide a counter-balancing tax break, potentially eliminating the effect of the Social Security tax. People who rely solely on Social Security for income will likely not pay any tax at all.
However, people under the age of 65 who have already begun collecting Social Security will be subject to the full tax — potentially on 85% of benefits — with no increase in the standard deduction.
A couple over 65 with up to $96,950 in taxable income in 2025 is in the 12% marginal tax bracket. So a boost of $12,000 to their standard deduction would provide a potential tax break of $1,400, whether or not they are collecting Social Security. A similar couple with $150,000 in taxable income is the in 22% tax bracket, and would receive a potential tax break of $2,640. That is substantial.
A couple with taxable income above $150,000 would see the deduction phase out and it would be completely gone for a couple with $250,000 income. I am assuming these people would still be eligible for the current $34,700 standard deduction for couples over 65.
The $6,000 bonus deduction would be available to taxpayers whether they take the standard deduction or itemize.
Here is an analysis from Govfacts.org:
Primary Beneficiaries: The main group to benefit are middle-income seniors aged 65 and over. These are individuals whose total income is high enough to create federal tax liability but low enough to fall below the phase-out thresholds. The White House Council of Economic Advisers estimated the new deduction would benefit 33.9 million seniors.
No Benefit for the Lowest-Income Seniors: The poorest seniors, whose total income is already below existing deduction thresholds, pay no federal income tax on their Social Security benefits. For this group, an additional deduction has no effect.
No Benefit for High-Income Seniors: Wealthier retirees with incomes above the phase-out thresholds are ineligible for the deduction and see no change in their tax liability from this provision.
Harry Sit, creator of TheFinanceBuff.com, just posted a good analysis of this issue, including a chart compiling the income phaseouts:

Key takeaway: Note that some significant tax benefits remain even when a person or couple gets close to the $175,000 or $250,000 limits. Some smart income planning could result in a lower tax bill for 2025.
The new law also includes a deduction on charitable contributions, according to CNBC. The bill allows charitable taxpayers who don’t itemize to deduct up to $1,000 for single filers and $2,000 for married couples filing jointly. This begins for tax year 2026 and may also apply in some form to taxpayers who itemize.
Based on excellent information provided by commenters, it appears all the new deductions will be “below the line,” meaning they will not reduce adjusted gross income, which is used to determine Medicare surcharge levels among other things. But they will reduce taxable income.
Why this is good
The bill cleverly shifts the tax break to a 4-year increased standard deduction instead of eliminating the tax on Social Security benefits. Why is that good? Because the tax on benefits is intact and goes back into the Social Security “trust fund,” helping to pay future benefits. The trust fund is currently expected to run dry in 2032 to 2034, potentially leading to a 19%+ cut in payments to all beneficiaries.
The Committee for a Responsible Federal Budget estimates the higher senior tax deduction through 2028 would result in a loss of $66 billion in revenue over the four years. But most of that lost revenue would be outside the Social Security system.
And the downside …
Because many senior citizens will now be reporting lower adjusted gross incomes, they will in turn potentially be paying 1) less in taxes on Social Security benefits and 2) less in Medicare surcharges imposed through the Income-Related Monthly Adjustment Amount, or IRMAA. GovFacts.org says:
The nonpartisan Committee for a Responsible Federal Budget (CRFB) estimates that the “senior bonus” and other tax changes in the bill will lower revenue collected from benefit taxation by approximately $30 billion per year. …
The CRFB projects that this revenue loss is significant enough to accelerate the projected insolvency date for the Social Security OASI trust fund (which pays retirement and survivor benefits) from early 2033 to late 2032.
The IRMAA trigger levels are not directly affected by increasing the standard deduction, because IRMAA is based on adjusted gross income, before the deduction is subtracted. But with the expanded deduction, some retired people may be making smaller taxable withdrawals or stock sales to supply current income, making it easier to stay below IRMAA trigger levels.
Thoughts
No one is a “fan” of the tax on Social Security benefits, or the Medicare IRMAA surcharges for that matter. But I understand the need for these taxes and surcharges to keep these important programs going. Not every problem can be solved with a tax cut.
So, I support the tax on Social Security benefits. The problem with the tax is that the trigger levels are much too low and have never been indexed to inflation, after 42 years. Too many people at fairly low income levels are paying the tax.
The tax is crucial to help delay insolvency of the Social Security trust fund. That day is coming and a solution needs to be found. I don’t expect anything to be done in the next three years, so the problem will simply get more severe.
Trump promised “no tax on Social Security” — an idea I did not support. Congress came up with a solution to give seniors a temporary, 4-year tax cut outside of the Social Security system, adding to the federal deficit but not putting a great deal of additional strain on Social Security.
The Wall Street Journal notes:
Under the fast-track legislative procedure that Republicans are using to pass their bill, they aren’t allowed to touch the Social Security trust funds, which is where some income taxes on benefits go. Republicans devised the senior bonus deduction as a way to give tax breaks to many of the same people who pay taxes on their Social Security benefits. …
“I would welcome any relief on taxes,” said Trump voter Peter Sullivan, 67, a retired financial executive in Strongsville, Ohio. He added: “It’s still short of my Social Security tax nirvana of having it completely tax-free.”
The tax on Social Security benefits is intact and under current law will continue after the $6,000 bonus standard deduction ends in 2028. My opinion: This is a good thing. I am sure some of you disagree. Express opinions in the comment section, but please avoid political attacks or tirades.
—————————

Donate? This site is free and I plan to keep it that way. Some readers have suggested having a way to contribute. I would welcome donations. Any amount, or skip it, your choice. This is completely optional.
—————————
Follow Tipswatch on X for updates on daily Treasury auctions and real yield trends (when I am not traveling).
Feel free to post comments or questions below. If it is your first-ever comment, it will have to wait for moderation. After that, your comments will automatically appear. Please stay on topic and avoid political tirades. NOTE: Comment threads can only be three responses deep. If you see that you cannot respond, create a new comment and reference the topic.
David Enna is a financial journalist, not a financial adviser. He is not selling or profiting from any investment discussed. I Bonds and TIPS are not “get rich” investments; they are best used for capital preservation and inflation protection. They can be purchased through the Treasury or other providers without fees, commissions or carrying charges. Please do your own research before investing.


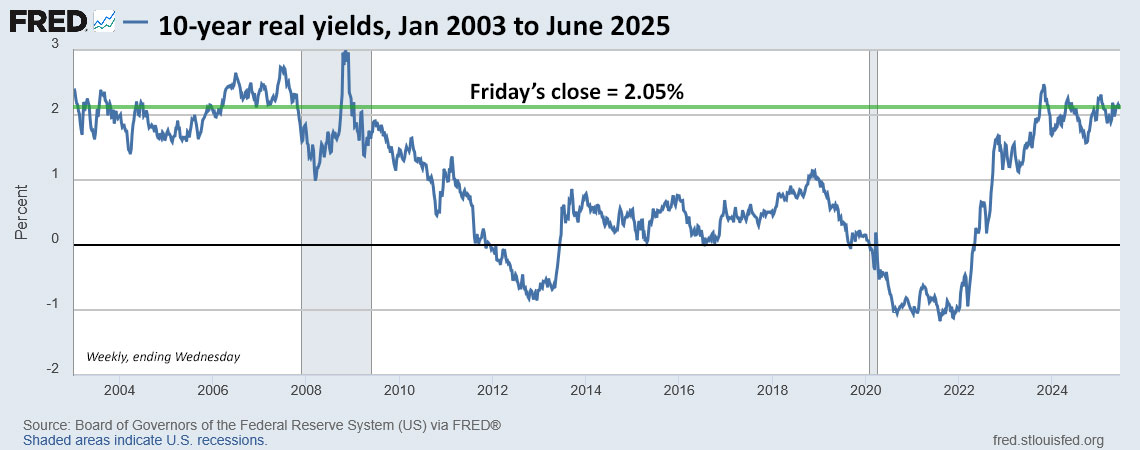
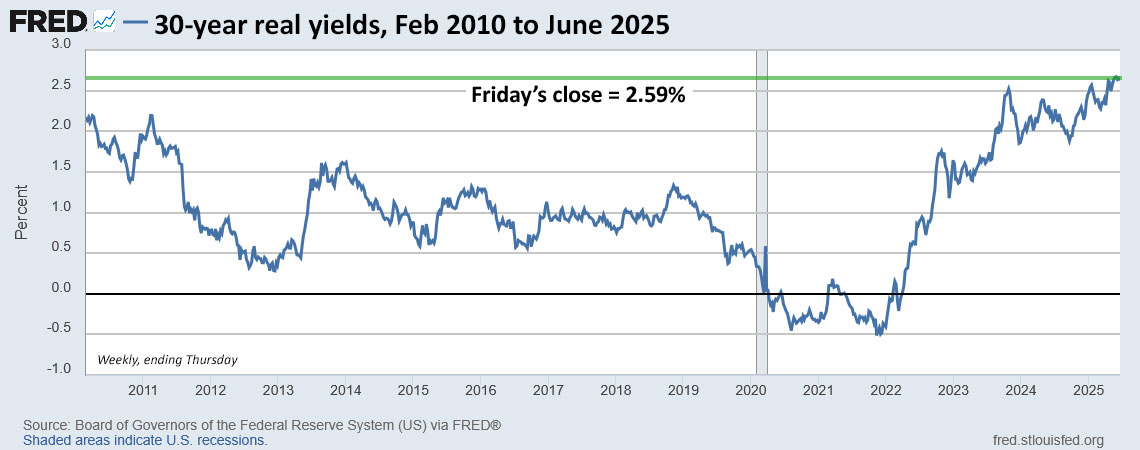


If I had funds at this moment I would buy long dated TIPS instead of iBonds. Those real yields are…