Catching up on TIPS (after two weeks in Canada)

Fort Anne

Beautiful Fort Anne, built in 1797 to protect the harbor of Annapolis Royal, Nova Scotia.

I’ve been away on vacation in Nova Scotia the last two weeks, away from a computer and (usually) far from e-mail or business news. So we have some catching up to do … plus there is a 10-year TIPS reissue auction coming up this week … and a new inflation report.

Bump in yields

When I left on August 30, the 10-year TIPS yield stood at 0.68%, plus inflation. Today it is about 0.76%, so it’s seen a bit of a boost. But within those two weeks, on September 5, it high a multi-year high of 0.92%. The inflation breakeven rate for a 10-year TIPS today stands at 2.12%, about where it was two weeks ago.

Today’s inflation report

The U.S. ‘headline’ inflation rate – technically known as the seasonally-adjusted Consumer Price Index for All Urban Consumers (CPI-U) – increased just 0.1% in August and is up a meager 1.5% over the last 12 months. The weak number was primarily caused by a 0.1% drop in the price of gasoline, and a 0.3% decline in energy overall. Food was up just 0.1%. Medical care services, however, were up a sharp 0.7%.

Holders of TIPS and I Bonds care most about the non-seasonally adjusted increase, which is used to adjust the principal on TIPS and set future rates for I Bonds. That increase was also 0.1% in August, and 1.5% over the last 12 months.

‘Core’ inflation, which strips out energy and food, was also up 0.1% in August and up 1.8% over the last 12 months, below the Federal Reserve’s target of 2%.

Today’s inflation report could tip the balance to cause the Federal Reserve to back away from plans to taper its QE3 purchases of Treasuries. That announcement could come Wednesday after a Federal Reserve meeting.

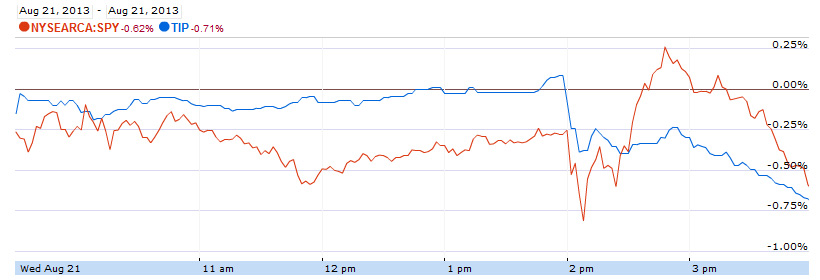
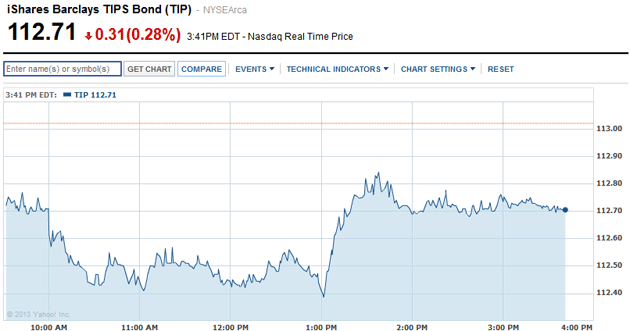
The early reaction to these numbers has TIPS yields falling today, with the 10-year TIPS trading at 0.70%, down 6 basis points from yesterday. The TIP ETF is up about 0.25% in early trading.

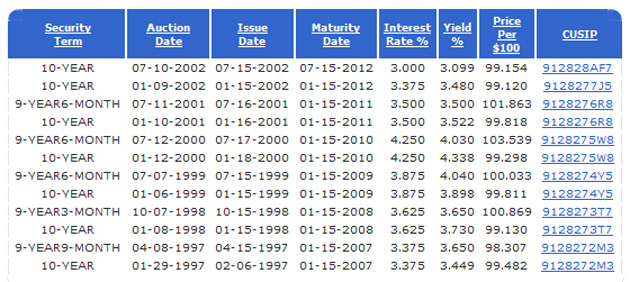
10-year TIPS reissue will auction Thursday

This is a reissue of CUSIP 912828VM9, which first auctioned July 18, 2013, with a coupon rate of 0.375% and a yield to maturity of 0.384%. That means Thursday’s auction will be going off at a discount, about $96.19 for $100 of value. But this TIPS also carries accrued interest (from inflation adjustments) of about 0.3%, which will also factor into the price.

I was a buyer of this TIPS back in July, and it is certainly more attractive now that the yield has risen more than 30 basis points.

Wednesday’s Fed announcement could roil the markets, so keep an eye out for reaction. If the Fed goes ahead and launches tapering, TIPS yields could rise substantially (although I theorize this has already been priced in).  If Fed decides to hold off on tapering, expect yields to decline.

More on this later. It’s good to be back.

Posted in Investing in TIPS | 3 Comments

How high will TIPS and Treasury yields rise?

Since May 1 of this year, we have seen a pretty-much unprecedented rise in Treasury yields, almost blindingly quick as the Federal Reserve began to slowly back away (verbally, not in action) from its bond-buying stimulus program.

  • On May 1, the 10-year nominal Treasury yielded 1.66%. Today it stands at 2.82%, a rise of 116 basis points
  • On May 1, a 10-year Treasury Inflation Protected-Security was yielding -0.64% and now is yielding 0.69%, an even higher rise of 133 basis points.

Can this continue? Can TIPS and Treasury yields rise another 100, 200 or even 250 basis points over the next year or two? The answer is yes, they can. I’d suggest an increase of nearly 200 basis points in the nominal 10-year Treasury looks probable if the economy continues to improve and Fed backs off from bond-buying, which holds yields down.

My thinking comes from looking at traditional Treasury rates and their spread over inflation, as shown in this chart for inflation and rates back to 1990:

Date 10-year Treasury Inflation rate that year Spread over inflation 10-year TIPS yield
1-Aug-90 8.29 4.7 3.59 NA
1-Aug-91 8.20 4.7 3.50 NA
1-Aug-92 6.72 3.1 3.62 NA
1-Aug-93 5.85 3.0 2.85 NA
1-Aug-94 7.13 2.5 4.63 NA
1-Aug-95 6.50 3.0 3.50 NA
1-Aug-96 6.65 2.8 3.85 NA
1-Aug-97 6.20 2.3 3.90 3.65
1-Aug-98 5.46 1.7 3.76 3.65
1-Aug-99 5.92 2.0 3.92 4.04
1-Aug-00 6.00 3.7 2.30 4.03
1-Aug-01 5.11 3.3 1.81 3.50
1-Aug-02 4.33 1.1 3.23 3.10
1-Aug-03 4.44 2.1 2.34 2.40
1-Aug-04 4.48 3.3 1.18 2.00
1-Aug-05 4.32 2.5 1.82 1.95
1-Aug-06 4.99 4.3 0.69 2.40
1-Aug-07 4.76 2.7 2.06 2.44
1-Aug-08 3.97 5.0 -1.03 1.63
1-Aug-09 3.66 -1.4 5.06 1.78
1-Aug-10 2.99 1.1 1.89 1.13
1-Aug-11 2.77 3.6 -0.83 1.09
1-Aug-12 1.56 1.7 -0.14 -0.07
1-Aug-13 2.74 1.8 0.94 0.38
Average 5.12 2.7 2.42 2.30
Median 5.05 2.8 2.60 2.40

So, some assumptions:

  1. Inflation. As the economy improves, inflation will return to its-more-less historic rate of 2.5% a year. I am being generous here, it could be higher. The Federal Reserve is practically guaranteeing that inflation will be above 2%, not capped there, but above 2% no matter what.
  2. Spread over inflation. Historically, a 10-year Treasury pays a yield about 2.5% above inflation. Obviously, that can vary widely from year to year, and has even dipped into the negative range in recent years.
  3. 10-year Treasury. The current rate of U.S. inflation is 1.8%, so even if you apply a 2% spread over inflation, you get a 10-year Treasury yield of 3.8%, 100 basis points higher than it is today. If inflation rises to 2.5% and the spread rises to 2.5%, you get a 10-year Treasury yield of 5%, 218 basis points higher than today. This is entirely possible, as the numbers show.
  4. 10-year TIPS. Since being introduced in 1997, the 10-year TIPS has had an average inflation breakeven rate of 2.04%. In recent years it has been riding between 2.0% and 2.5%, and is currently at 2.13%.
  5. Projecting the TIPS yield. Using the average breakeven rate (which is pretty low, in my opinion), a 10-year nominal Treasury paying 3.8% results in a 10-year TIPS yield of 1.76%, a rise of 107 basis points. A Treasury paying 5% results in a 10-year TIPS yield of 2.96%, a rise of 227 basis points.

Improbable?  Sure the high end of that TIPS yield looks unlikely. But a 10-year TIPS paying 2.96% would not be an anomaly. In fact, every 9- or 10-year TIPS auction from 1997 to July 2002 had a yield higher than 2.96%:

TIPS auctions

It’s interesting to note how consistent those yields are, across a period of time that including a booming economy (late 1990s) to a savage stock market collapse (early 2000s). I would argue that these yields were the norm, not an anomaly. Instead, the ultra-low, artificially manipulated rates of 2011 to early 2013 were the anomaly, and that anomaly is now returning to the norm.

What it means. Nothing is certain. The economy could nose-dive, war could erupt in the Mideast, China could collapse. That would send TIPS yields plummeting. I am comfortable making small investments in TIPS at these current rates, to add to a portfolio.

But if the economy continues to improve, and the Federal Reserve halts bond-buying, we are looking at inflation of 2.5% a year and TIPS and Treasury rates at least 100 basis points higher.

Posted in Investing in TIPS | 5 Comments

4-year, 8-month TIPS auctions at -0.127%, a 3-year high

Treasury logoThe U.S. Treasury just announced that its reissue of a 4-year, 8-month TIPS auctioned with a yield to maturity of   -0.127%, the highest yield for any 4- or 5-year TIPS issued in more than three years. Read the announcement.

This is CUSIP 912828UX6. It carries a coupon interest rate of 0.125%, meaning that today’s buyers at auction had to ‘pay up’ to get that coupon rate, about $102.18 per $100 of value, a cost that includes about $1 of accrued inflation since April 15. This TIPS was originally issued in mid-April with a yield to maturity of -1.311% and a cost of $107.82 per $100 of value.

The auction demonstrates the incredible surge in Treasury yields since April, when Treasuries of nearly all types were trading with yields more than 100 basis points below where they stand today.

Just before the auction, this TIPS was trading in the secondary market with a yield of -0.20% or lower, so the -0.127% yield looks like a good deal for buyers, and indicates demand was probably lukewarm for this issue.

But the yield did remain barely negative, marking the 8th consecutive auction of a 4- to 5-year TIPS with a yield negative to inflation. (Holders of TIPS see their principal rise with inflation until maturity.) The last positive 5-year auction was a new issue in April 2010 with a yield of 0.550%.

Reaction to the auction. From a report by the Wall Street Journal‘s Min Zeng:

TIPS have sold off more sharply compared to regular Treasury bonds as the prospect of the Fed cutting back on easy-money stimulus reduce fears over inflation. Demand for inflation-hedging products has pulled back sharply this year …

So far this year, investors have yanked $16.5 billion out of TIPS bond funds and ETFs, already surpassing the redemption of $2.9 billion in 2006, the biggest calendar-year outflow since Lipper started tracked the data in 2002.

“It is a terrible environment as rising yields and low inflation are bad combination for TIPS,” said Jeff Tjornehoj, head of Lipper Americas Research.

Inflation breakeven rate. The 5-year nominal Treasury is currently trading at 1.70%, creating an inflation breakeven point for this TIPS of 1.827%. That means if inflation averages more than 1.8% over the next five years, this TIPS will outperform the nominal Treasury.

Posted in Investing in TIPS | 7 Comments

TIPS watchers ask: What exactly did the Federal Reserve minutes say?

It was quite an auction-eve day in the market yesterday, with Federal Reserve minutes released at 2 p.m., setting both the stock and bond markets into a tizzy. We are setting up for an interesting Treasury auction today for a 4-year, 8-month TIPS, a reissue of CUSIP 912828UX6.

I can depict the market’s reaction visually with this chart:

Aug 21 chart

Both the stock market (depicted in red with the SPY ETF) and the TIPS market (in blue with the TIP ETF) took an immediate dive after the Fed minutes were released at 2 p.m. The stock market tried to rally, but fell back.

So what did the Fed say to cause this reaction? You can read the Federal Reserve minutes and judge for yourself.  I’ll just hit some of the high points:

  • The economy. “(E)conomic activity expanded at a modest pace in the first half of the year. Private-sector employment increased further in June, but the unemployment rate was still elevated. … The staff continued to forecast that the rate of real GDP growth would strengthen in 2014 and 2015.”
  • Inflation. “Consumer price inflation slowed markedly in the second quarter, likely restrained in part by some transitory factors, but measures of longer-term inflation expectations remained stable. … The staff continued to judge … that inflation would pick up somewhat in the second half of this year. … (I)nflation was forecast to be subdued through 2015.”
  • Employment. “Private nonfarm employment rose at a solid pace in June, as in recent months, while total government employment decreased further. The unemployment rate was 7.6 percent in June, little changed from its level in the prior few months.”
  • Consumer spending. “(S)ome key factors that tend to support household spending were more positive in recent months; in particular, gains in equity values and home prices boosted household net worth, and consumer sentiment … rose in July to its highest level since the onset of the recession. … However, a few participants expressed concern that higher household wealth might not translate into greater consumer spending.”
  • Housing. “The housing sector continued to pick up, as indicated by increases in house prices, low inventories of homes for sale, and strong demand for construction.”
  • A slap at Congress. “Participants reported further signs that the tightening in federal fiscal policy restrained economic activity in the first half of the year: Cuts in government purchases and grants reportedly had been a factor contributing to slower growth in sales and equipment orders.”
  • The ‘Fed-effect.’ “Financial markets were volatile at times during the intermeeting period as investors reacted to Federal Reserve communications and to incoming economic data.”
  • Tapering of QE3 bond-buying. “(I)f economic conditions improved broadly as expected, the Committee would moderate the pace of its securities purchases later this year. And if economic conditions continued to develop broadly as anticipated, the Committee would reduce the pace of purchases in measured steps and conclude the purchase program around the middle of 2014.”
  • Tapering data points. “(U)nemployment would be in the vicinity of 7 percent, and inflation would be moving toward the Committee’s 2 percent objective.”

What it all means

For TIPS holders and purchasers, there are a couple of important points: 1) the Federal Reserve remains on track to begin tapering its bond-buying program, possibly in the next few months, and 2) the Fed is committed to getting inflation to 2%, or above.

The end of bond-buying is already being priced into the bond market, and thus since May we’ve had more than 100 basis point increases in yields for 5-, 10- and 30-year TIPS.

Today’s 5-year TIPS auction looks like it will price with a yield as high as -0.20%, maybe even higher. I’d guess it will be in the -0.20% to -0.25% range, looking at data right now. Four months ago, it auctioned with a yield of -1.311%. Amazing.

Posted in Investing in TIPS | 1 Comment

Tips on TIPS: How to estimate (guess) a yield for an upcoming auction

Interest rates fluctuate, day by day, hour by hour. That fact makes predicting the future auction yield of a Treasury Inflation-Protected Security pretty difficult, even impossible. But you can guess, and sometimes you can get fairly close, if you watch indicators right up to the morning of the auction.

So in this post I will share some of the data sources I use to check on TIPS yields. And I will use Thursday’s reissue auction of a 5-year TIPS as an example.

1. Check the Treasury’s Daily Real Yield Curve rate

The Treasury posts this each day, and you can track data going back many years. As of Friday, a ‘pure’ 5-year TIPS was yielding -0.19%, up 10 basis points from the day before. Since this is an estimate for a TIPS maturing in a full 5 years, it isn’t perfect for Thursday’s reissue, which has a term of 4 years, 8 months. But it should be close.

Where does the Treasury get this number? Good question. It explains in a footnote that the numbers are “calculated from composites of secondary market quotations obtained by the Federal Reserve Bank of New York.” However they do it, the numbers seem pretty accurate and often signal a future trend.

2. Check the secondary market for TIPS

I use the Wall Street Journal’s data site, which also provides historical data, just use the little calendar icon in the top right corner of the chart. When a TIPS is reopening, like at Thursday’s auction, these numbers are especially helpful, because that TIPS is already trading on the secondary market. Here is last Friday’s close for the TIPS that matures April 2018 and will be reissued Thursday:

April 2018 TIPSAs you can see, the yield here, -0.315%, is much lower than the -0.19% projected by the Treasury. So we have a discrepancy, and that would make me think an auction today would produce a number higher than -0.315%. Another helpful item is the bid and asked price – notice the very wide spread. That also indicates a coming change in yield. It also gives you a rough estimate of what you will pay for this TIPS at auction — maybe about $10,132 for $10,000 of value. (Buyers back in April paid dearly, $10,782 for $10,000 of value to get a 0.125% coupon.)

This chart is helpful even for new issues, you can check a TIPS with the closest maturity date. But these numbers aren’t perfect as predictors.

3. Check Bloomberg’s current yields for U.S. government bonds

This is the closest thing you can get to a ‘real-time’ quote, but it also isn’t perfect at predicting an auction price. Right now, at 10 a.m. Monday, it is showing a yield of -0.28% for the 5-year TIPS being auctioned Thursday. It shows a price of 101-29, very close to the bid price shown in the Wall Street Journal’s data. So it looks like the combination of Friday’s Treasury data and the secondary market data did accurately predict a rise in rates this morning.

Another number on this page worth watching is the nominal 10-year Treasury, which is currently trading at a yield of 2.86%. It closed at 2.84% on Friday, so this also shows weakness in the Treasury market.

4. Check the current price of the TIP ETF

I use Yahoo Finance for this. On the morning of the auction, after 9:30 am and before noon when the auction closes to non-competitive bids, check the TIP stock price. If it is down, you are likely to get a higher yield that you expected; if it is up, you are probably going to get a lower yield.

Today, at 10:05 a.m., it is trading at 110.14%, down 0.33%, and confirming weakness in the TIPS market. So we can expect yields to rise slightly if this trend continues.

It’s also fun to check the ETF after the auction announcement at 1 p.m. The TIP market often has a pretty strong reaction to auction results, positive or negative, and you can see the move right at 1 p.m. Here’s an example from July 18, 2013:

july18And still … it ain’t perfect. Predicting a TIPS yield at auction can make you humble. New issues, especially, are difficult to predict because new inventory is being added to the market. Another factor is Federal Reserve bond buying; you can’t be sure what influence that is having in the market. It’s hard to be a buyer competing with the Fed, and it can use its financial might to set a rate where it wants, when it wants.

But using these data sources can give you a pretty good idea where a TIPS yield is heading on the day of the auction.

Posted in Investing in TIPS | 9 Comments