
Both all-items and core inflation increased 0.3% in April, as predicted.
By David Enna, Tipswatch.com
After three months of higher-than-expected inflation, U.S. prices in April increased on target, setting off a euphoric mood in the stock and bond markets.

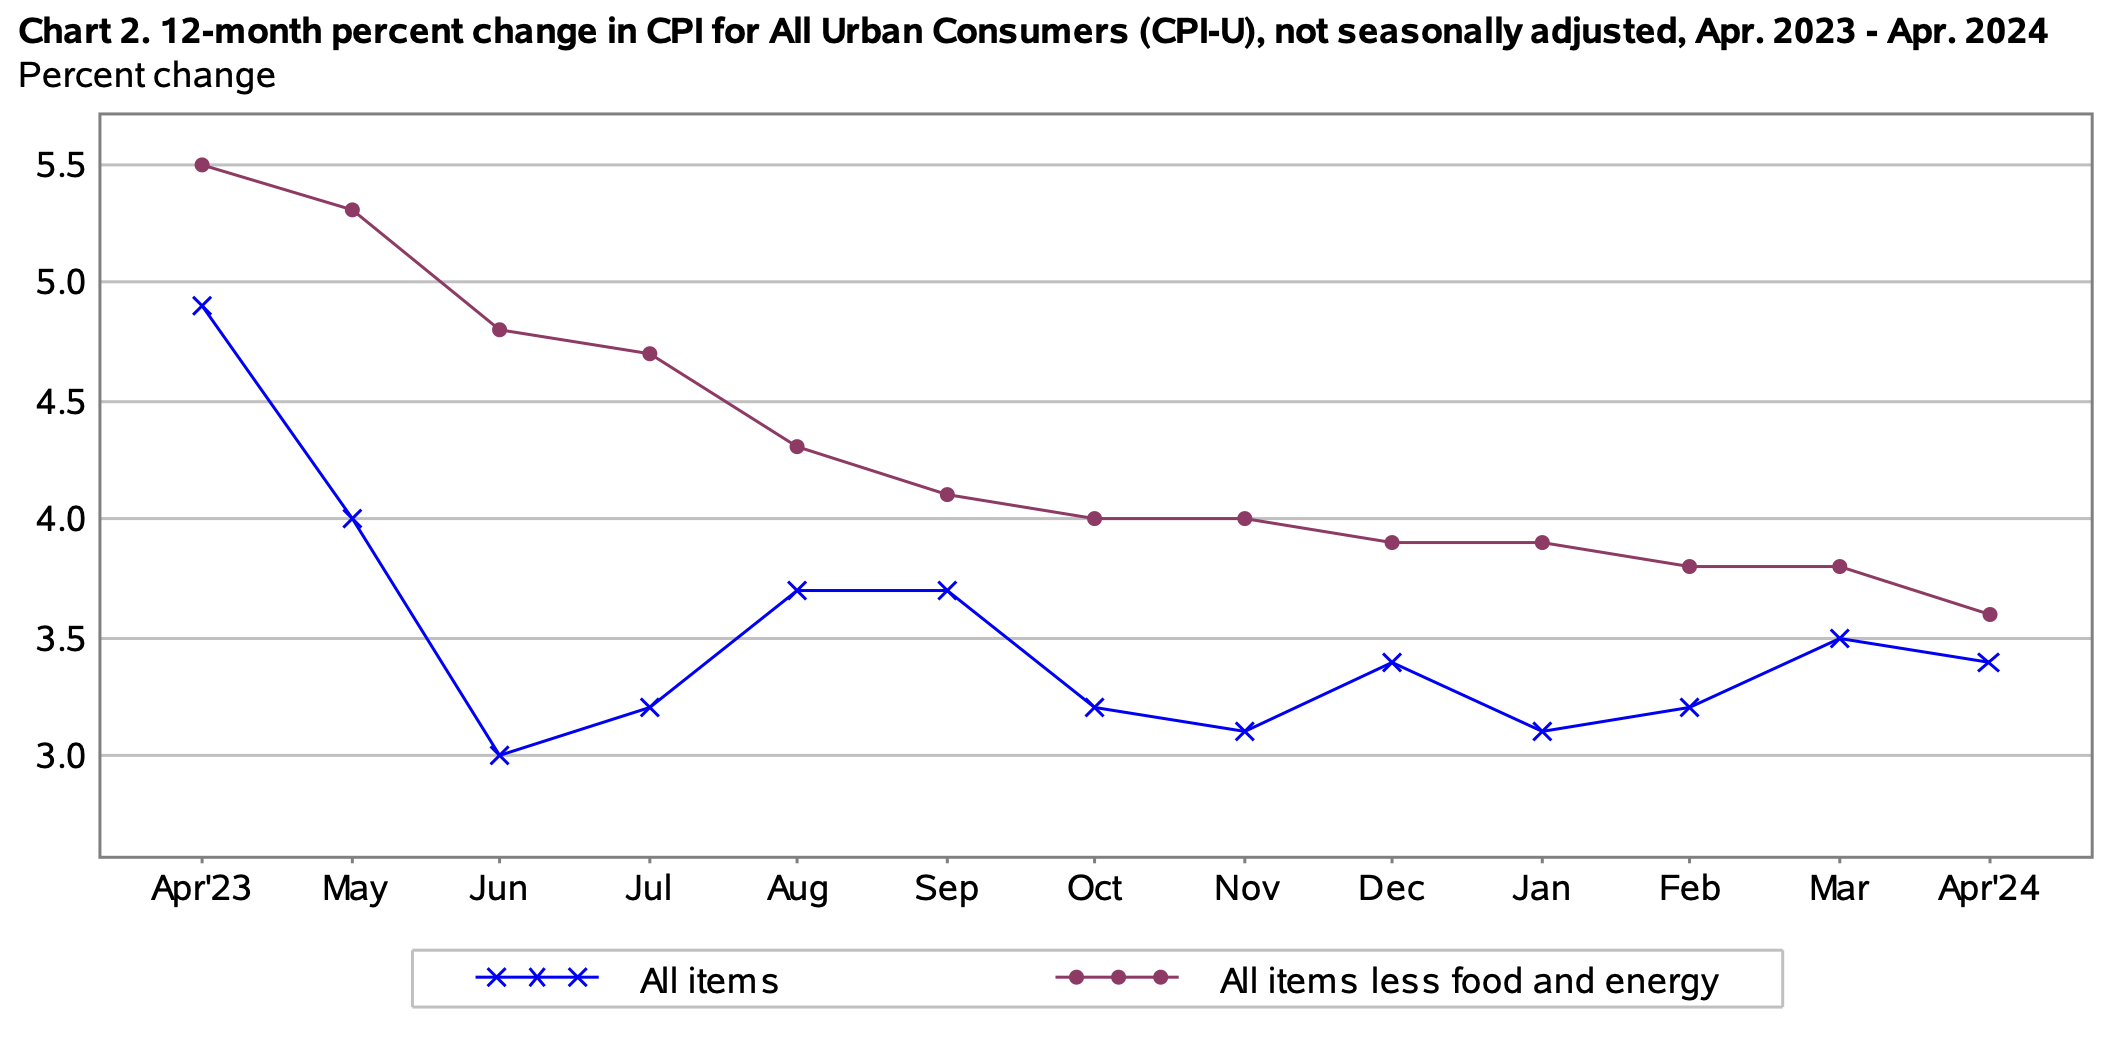
The Consumer Price Index for All Urban Consumers increased 0.3% in April on a seasonally adjusted basis, the U.S. Bureau of Labor Statistics reported today. Over the last 12 months, the all items index increased 3.4%. Those numbers exactly matched expectations.
Core inflation, which removes food and energy, also matched expectations, coming in at 0.3% for the month and 3.6% year over year.
For stock and bond markets, meeting expectations was just fine. By 11 a.m. EDT, the Standard & Poor 500 index was up about 0.85% for the day, and the total bond market was up about 0.57%. A lot of media headlines were putting a positive spin on the BLS report, noting that annual inflation dipped from 3.5% in March to 3.4% in April.
Of course, I could point out that all-items inflation had fallen to 3.1% in January, well below the current 3.4%. On the other hand, core inflation has been steadily declining since November 2023, and fell from 3.8% in March to 3.6% in April, a positive trend.
So, yes, overall this was a positive inflation report and one the markets needed to see. The BLS noted that increases in shelter costs (up 0.4% in April and 5.5% year over year) and gasoline prices (up 2.8% for the month but only 1.1% for the year) accounted for 70% of the all-items increase for April. More from the report:
- The cost of food at home fell 0.2% in April and is up only 1.1% year over year. The overall food index was unchanged for the month.
- Costs of used cars and trucks fell 1.4% for the month and are down 6.9% for the year.
- New vehicle prices fell 0.4% for the month and year.
- Costs for motor vehicle insurance increased 1.8% for the month and a whopping 22.6% over the last year.
- Apparel costs increased 1.2% in April and are up 1.3% year over year.
- The medical care index rose 0.4% in April after rising 0.5% in March.
What this means for TIPS and I Bonds
Investors in Treasury Inflation-Protected Securities and U.S. Series I Savings Bonds are also interested in non-seasonally-adjusted inflation, which is used to adjust principal balances on TIPS and set future interest rates for I Bonds. For April, the BLS set the CPI inflation index at 313.548, an increase of 0.39% over the March number.
For TIPS. The April inflation report means that principal balances for all TIPS will increase 0.39% in June, after rising 0.65% in May. Keep in mind that non-seasonally adjusted inflation tends to run higher that headline CPI from January to June, and then lower from July to December.
Here are the new June Inflation Indexes for all TIPS.
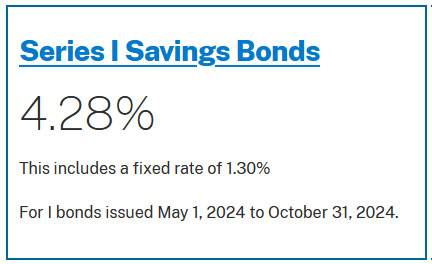
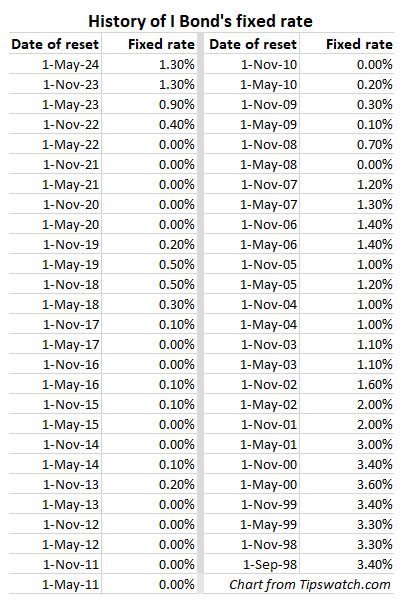
For I Bonds. The April inflation report is the first of a six-month string that will determine the I Bond’s new inflation-adjusted variable rate, which will be reset on November 1 based on inflation from April to September 2024. So far, for one month, inflation has increased 0.39%. We can’t make any assumptions from that single month. Here are the relevant data:
What this means for future interest rates
The April report solidifies the Federal Reserve’s recent statements that short-term interest rates may not need to rise higher. And it probably could create momentum toward a cut in the federal funds rate later this summer. But it was just one month, and inflation came in “as expected,” still well above the Fed’s potential target of 2.0%. (The Fed more closely follows a different inflation index, Personal Consumption Expenditures, but can’t ignore a high rate of CPI.)
From today’s Bloomberg report:
While the figures may offer the Fed some hope that inflation is resuming its downward trend, officials will want to see additional readings to gain the confidence they need to start thinking about cutting interest rates. … “It does open the door to a potential rate cut later in the year,” said Kathy Jones, Charles Schwab’s chief fixed-income strategist. “It will take a few more readings indicating that inflation is coming down for the Fed to act.”
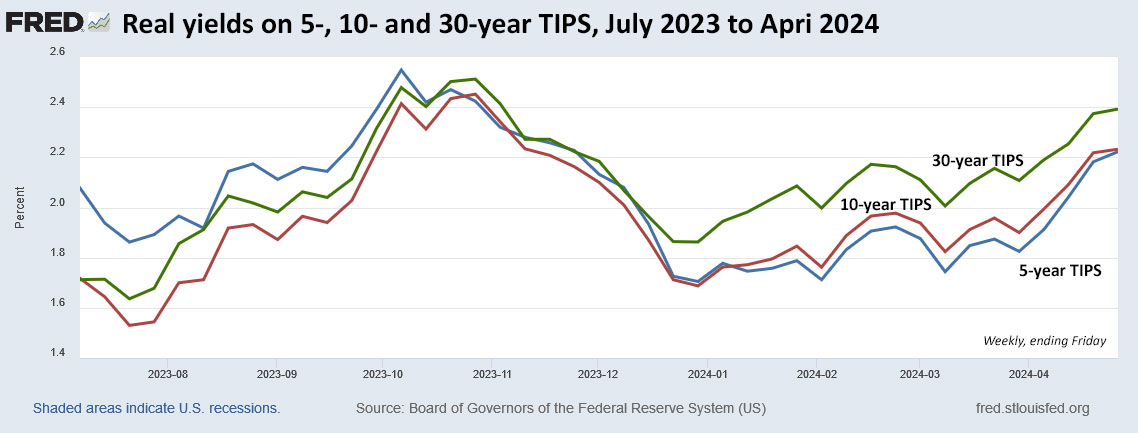
The report had an immediate effect on longer-term nominal and real yields, with the yield on a 10-year Treasury note falling about 9 basis points to 4.36% — far below the 4.65% reading at the beginning of May. The real yield on a 10-year TIPS fell about 7 basis points today to 2.05%.
* * *
Feel free to post comments or questions below. If it is your first-ever comment, it will have to wait for moderation. After that, your comments will automatically appear.Please stay on topic and avoid political tirades.
David Enna is a financial journalist, not a financial adviser. He is not selling or profiting from any investment discussed. I Bonds and TIPS are not “get rich” investments; they are best used for capital preservation and inflation protection. They can be purchased through the Treasury or other providers without fees, commissions or carrying charges. Please do your own research before investing.


2.5% to 2.7%+ Real yield above inflation on 20 to 30-year TIP bonds.