
By David Enna, Tipswatch.com
A new 30-year Treasury Inflation-Protected Security — CUSIP 912810TP3 — auctioned today with a real yield to maturity of 1.550%, the highest auctioned yield for this term since June 2011.
The auction seems to have attracted lukewarm demand. A 29-year TIPS was trading on the secondary market all morning with a real yield of 1.53% and the “when issued” yield prediction for this TIPS was also 1.53%. The bid to cover ratio was a middling 2.38.
So investors were able to nab a slightly higher real yield, and that’s a good result. The real yield to maturity of 1.55% was the highest for any 29- to 30- year TIPS at auction since June 2011, when a 29-year, 8-month TIPS got a real yield of 1.744%. The Treasury set the coupon rate at 1.50%, the highest for any TIPS since a February 2011 new-issue auction at 2.125%.
Definition: The “real yield” of a TIPS is its yield above official future U.S. inflation, over the term of the TIPS. So a real yield of 1.55% means an investment in this TIPS will exceed U.S. inflation by 1.55% for 30 years. If inflation averages 2.3%, you’d get a nominal return of 3.85%, on par with a nominal 30-year U.S. Treasury. But if inflation averages 4.5%, you’d get a nominal return of 6.05%.
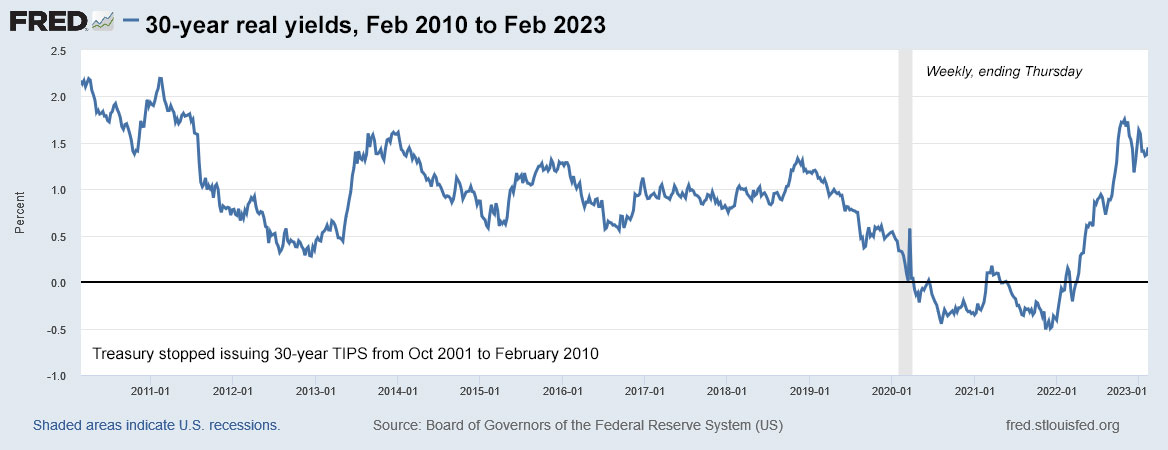
Here is the trend in the 30-year real yield since January 2021, more than a year before the Federal Reserve began aggressive moves to increase interest rates and fight inflation:

Pricing for this TIPS
The unadjusted price was $98.804809 for $100 of value, meaning that investors actually paid less than par value for this TIPS.

The key factors here are that the unadjusted price was about $98.80 for $100 of value and the inflation index on the settlement date of Feb. 28 will be 0.99857. Accrued interest will be about 53.8 cents per $1,000 investment. Here is how the pricing works out:

One note: Anyone who purchased $10,000 in this TIPS got $10,000 in par value, but the actual principal total on the settlement date of Feb. 28 will be $9,985.70, because the inflation index was less than 1.0. This reflects deflation of 0.31% recorded in December 2022. But in March, this TIPS will get an inflation accrual of 0.8%, based on non-seasonally adjusted inflation recorded in January 2023.
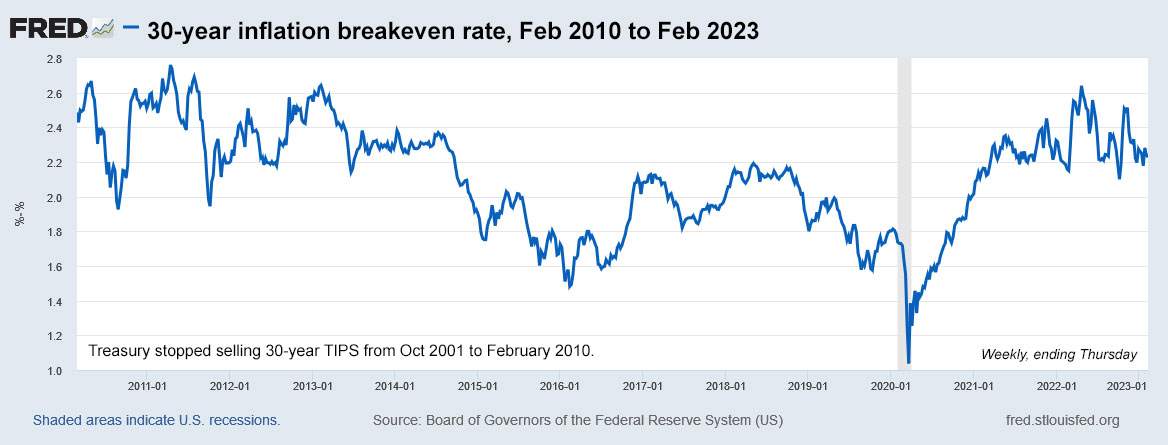
Inflation breakeven rate
With a 30-year nominal Treasury trading with a yield of 3.90% at the auction’s close, this TIPS gets an inflation breakeven rate of 2.35%, a bit higher than recent results for this term. In the February 2022 auction for this term, the breakeven rate was 2.11%. Here is the trend in the 30-year inflation breakeven rate since January 2021, showing the fairly strong variations caused by the financial market’s hot and cold opinions of U.S. inflation:

Reaction to the auction

It was a good result for investors, with both the real yield and coupon rate topping 1.5%, the highest in nearly 12 years. The TIPS market seems to be reacting with a yawn, with the TIP ETF barely nudging higher after the auction’s close. The 30-year maturity isn’t highly traded and makes up only a small portion of the TIP ETF’s holdings. No big deal, it appears.
For people with the fortitude to buy a highly volatile 30-year Treasury, this is an attractive purchase, locking in a yield 1.55% higher than official U.S. inflation over 30 years.
Here is a recent history of auctions of this term:

• Confused by TIPS? Read my Q&A on TIPS
• TIPS in depth: Understand the language
• TIPS on the secondary market: Things to consider
• Upcoming schedule of TIPS auctions
* * *
Feel free to post comments or questions below. If it is your first-ever comment, it will have to wait for moderation. After that, your comments will automatically appear.Please stay on topic and avoid political tirades.
David Enna is a financial journalist, not a financial adviser. He is not selling or profiting from any investment discussed. I Bonds and TIPS are not “get rich” investments; they are best used for capital preservation and inflation protection. They can be purchased through the Treasury or other providers without fees, commissions or carrying charges. Please do your own research before investing.


Thanks for the detailed explanation. I believe you are saying the "breakeven inflation rate" should reflect the inflation expectation rather…