
By David Enna, Tipswatch.com
Back in early July, I wrote an article suggesting a strategy of staggering purchases of short-term Treasurys to boost your gains on cash holdings. I raised this idea because yields on Treasury bills (often called T-bills) were already higher and rising faster than yields you could find at a bank or money market fund.
Why stagger the purchases, laddering them a few weeks apart? This allows you to gain from rising interest rates, while also giving you easier access to your cash if you need it.
That strategy certainly has worked. Here are the typical cash-equivalent yields I listed in that article on July 4, compared to current returns after several months of Federal Reserve rate hikes:
- 1-year Treasury bills, yielding 2.79% then. Now: 4.03%
- 26-week Treasury bills, yielding 2.62% then. Now: 3.86%
- 1 year bank CDs, yielding 2% then. Now: 3.1%
- 13-week Treasury bills,yielding 1.73% then. Now: 3.35%
- 4-week Treasury bills, yielding 1.27% then. Now: 2.57%
- Vanguard Treasury Money Market, yielding 1.11% then. Now: 2.34%
- Online bank savings accounts, typically yielding 1% to 1.2%. Now: 1.9%
- 6-month bank CDs, yielding 1% then. Now: 2.5%
- Fidelity Treasury Money Market, yielding 0.98% then. Now: 1.86%
- 3-month bank CDs, about 0.35% then. Now: 1.5%.
As I noted in that July article — and it is still true today — the sweet spot in the T-bill yields seems to be in the 13-week and 26-week maturities. The 26-week is now just 10 basis points lower than the 2-year Treasury, which closed yesterday at 3.86%. The 13-week is desirable because the shorter term allows you to get access faster to future rate increases.
Here is the current nominal yield curve for all Treasury issues, based on the Treasury’s Yield Curve estimates, which are updated daily after the market’s close:
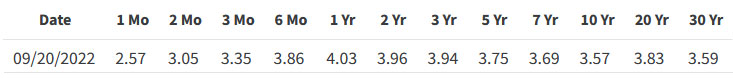
The short-end of the curve still looks the most attractive, but I would be highly tempted to dive into a 5-year Treasury note if the yield surpasses 4.0%, which definitely looks possible. Who knows what will happen to yields over the next 5 years? But it seems to make sense to lock in a rate that is historically attractive. The last time the 5-year yield exceeded 4% was October 2007, just before the Great Financial Crisis cut yields in half.
Obviously these short-term rates will be rising in the next week, in the aftermath of the Federal Reserve’s increase in its federal funds rate, to be announced today. The 4-week T-bill should be rising to around 3.25% if the Fed raises the rate 75 basis points. The 13-week and 26-week probably have already built some of the increase in, but still should move higher.
How to stagger your purchases
Here is the example I used in the July article, supposing that you are looking to put $60,000 in cash to work, using TreasuryDirect. New 13- and 26-week T-bills are auctioned every Monday. (This strategy would also work using a brokerage firm that allows auction purchases without any fees or commissions.):
13-week Treasurys. You could make three purchases of $20,000 each, four weeks apart. Then you can roll these purchases over on TreasuryDirect, meaning you will always have access to $20,000 within about 4 weeks. This strategy will quickly adapt to rising interest rates. Staggering 13-week Treasury bills is a good strategy for someone who might need the cash back in a short time.
26-week Treasurys. You could make three purchases of $20,000 each, eight weeks apart. Again you could roll these purchases over, riding interest rates higher, and always have access to $20,000 within eight weeks. Staggering 26-week Treasurys is a good strategy for someone who feels comfortable with a little longer delay in re-accessing the cash.
A combination. Put $30,000 in staggered 13-week Treasury bills, and $30,000 in staggered 26-week Treasury bills. You’d ride interest rates higher, get a slight yield boost for the 26-week term, and still have access to $10,000 within four weeks.
The July article lays out a step-by-step guide for using TreasuryDirect to make and schedule the purchases. I have used this technique, and it works well. I haven’t used a brokerage to make short-term Treasury purchases, so I can’t say how smooth that process is. But it should be fine.
When to quit this strategy?
I’d be OK with continuing these rollover investments if the Fed announces a “stall” on raising future interest rates (that could happen in 2023, certainly). But at that point, bank CDs might begin catching up with the Treasury rates — or could be offering attractive promo rates. During this time it might be wise to begin paring down the T-bill holdings and looking for longer-term issues.
If you believe the Fed is about to begin cutting interest rates (it will give signals) it will be time to unwind this strategy. In 2019, the 13-week T-bill rate fell from 2.47% on April 29 to 1.55% on Dec. 31. So, in normal circumstances, you will have time.
Video: Another viewpoint
Jennifer Lammer of Diamond NestEgg posted a video Sept. 26 on this same topic from a slightly different approach. As usual, it’s clear and well organized (and she mentioned my site!). Here is the video:
* * *
Feel free to post comments or questions below. If it is your first-ever comment, it will have to wait for moderation. After that, your comments will automatically appear.
David Enna is a financial journalist, not a financial adviser. He is not selling or profiting from any investment discussed. The investments he discusses can be purchased through the Treasury or other providers without fees, commissions or carrying charges. Please do your own research before investing.


As always, David, thanks for such a clear concise summary of the situation--I will rest easy waiting to April 10--and…