
When I started writing this TIPSwatch blog two years ago, I figured I was carving out a boring, staid corner of the investment world, a place where I could share ideas and learn from others. But excitement? Never. Not with TIPS.
But it just so happens that in April 2011, rumblings were beginning in the world of TIPS and Treasury investing. When I look back at TIPS yields in the last two years, I’ve been fascinated to note that in mid-2011, something shifted. Yields dropped dramatically to levels that then seemed impossible: Negative to inflation? At the same time, TIPS grew in popularity, a trend that has continued for two years. Why?
The background
On Jan. 20, 2011, the Treasury auctioned a 10-year TIPS with a coupon rate of 1.25% and a yield to maturity of 1.170%. This was a routine auction and a routine yield. Eight months later, on Sept. 22, this same TIPS was reissued with a yield of 0.078%. A drop of 109 basis points!
This chart shows the amazing drop in TIPS yields over the course of 2011:
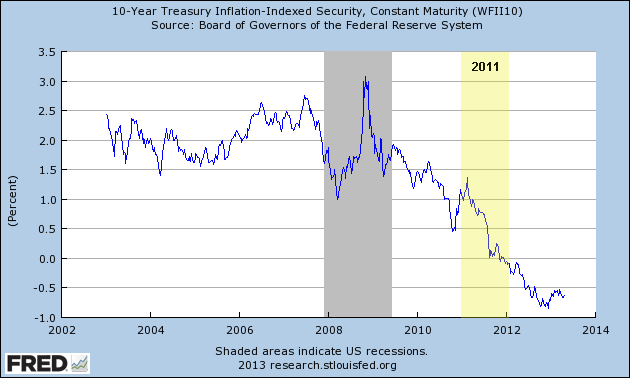
Below is a chart of month-to-month TIPS yields in 2011, with the month of July highlighted because yields dropped as much as 50 basis points in that single month, sending TIPS prices soaring:

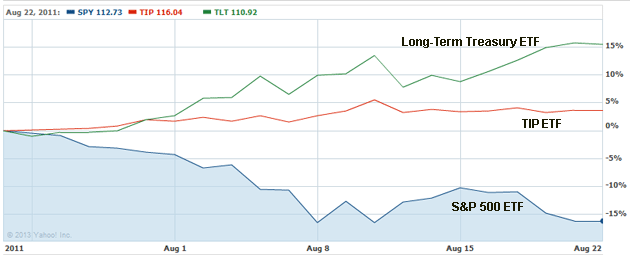
But was this a surge in the entire bond market? Or did this earthquake strike selectively and suddenly? The chart below compares the TIP ETF with the AGG (aggregate bond index). The funds have similar intermediate-term durations, and sometimes track fairly closely. But not in 2011:

This particular chart fascinates me, because again it seems to point to July-August 2011 as the turning point, with TIPS leaping in demand, while the overall bond market was performing mildly. In this next chart I’ve added the volatile long-term Treasury ETF (TLT) and the S&P 500 (SPY) to show that yes, indeed, the earthquake struck precisely in mid 2011 and hit Treasuries (positively) and stocks (negatively):

The earthquake: A surprise ending
I have always been quick to blame Federal Reserve manipulation of the Treasury market for the pathetically low yields on TIPS. So one of the QEs must be behind this sudden shift? Wrong.
- QE1 began in November 2008
- A second phase of QE1 began in March 2009
- QE2 began in November 2010
- Operation Twist began in September 2011
- QE4 began in December 2012
Operation Twist, it turns out, was a reaction to the earthquake, not the cause of it. And while the Fed certainly has succeeded in keeping Treasury rates extremely low, it wasn’t the direct cause of the earthquake.
How about the crisis in Europe? Could that have been the cause? No, the Euro crisis had been brewing well before mid 2011. Again, it was only a contributing factor.
Something else happened exactly in late July to early August 2011, and it was the direct cause of Treasurys soaring and the stock market plummeting. Here are some headlines from that time:
- July 22: Obama again presses GOP to move on taxes in debt deal
- July 24: Debt-ceiling standoff grinds on
- July 25: Obama says debt deal must include revenues
- July 26: GOP leaders seek to build support for Boehner debt plan
- July 27: An ‘altar call’ as Boehner pushes GOP for votes
- July 28: House delays vote on Boehner debt plan
- July 29: Obama blasts Boehner debt-ceiling bill, calls for bipartisan deal
- July 29: Amid crisis, TIP ETF hits an all-time high
- July 31: Parties agree to debt-ceiling deal, pending votes in Congress
- Aug. 1: U.S. leaders strike debt deal to avoid default
- Aug. 1: Debt ceiling deal accomplishes little
All leading to this, epicenter of the earthquake event:
The amazing thing: At the time, I was convinced that the S&P action would put pressure on U.S. government debt, causing interest rates to rise. Instead, it caused massive discontent with the U.S. government and fear for our nation’s future.
Fear was the trigger: The stock market dropped and Treasurys soared. The Federal Reserved stepped in – one month later – to begin Operation Twist, but at that point it had no option. The president and Congress had no answer. One last chart to show the massive one-month moves in Treasurys and the stock market:
We now know the S&P action had zero effect on the appeal of Treasurys. And TIPS became even more popular because of their inflation protection. Runway federal spending, combined with Federal Reserve stimulus, raised the specter of inflation.
Not much has changed in the last 20 months, and inflation is still a specter, not a reality.

Pingback: Fitch downgrades U.S. debt and we should have seen it coming | Treasury Inflation-Protected Securities
Pingback: What would ‘normal’ TIPS yields look like? | Treasury Inflation-Protected Securities
Pingback: Next up: New 10-year TIPS auctions Jan. 23, 2014 | Treasury Inflation-Protected Securities
Pingback: Would U.S. default create a ‘perfect storm’ for TIPS? | Treasury Inflation-Protected Securities
Pingback: Where do we stand now with TIPS? | Treasury Inflation-Protected Securities
Pingback: Honey, there’s a hole in our TIPS ladder! | Treasury Inflation-Protected Securities
Pingback: Next up: New 10-year TIPS to be auctioned July 18, 2013 | Treasury Inflation-Protected Securities
Bill I agree that yields on nominal Treasuries also went down sharply. The 10-year, for example, dropped from 2.30% on July 20, 2011, to 1.52% on August 8, two days after the S&P downgraded U.S. debt. TIPS and Treasuries more or less moved in tandem. But in my opinion the very quick decline in yields was definitely triggered by the debt crisis, lack of resolution, and the inevitable downgrading.
The “earthquake” in July 2011 was when the real yield of the 10-yr T-note broke through the zero line. The 10-yr TIPS merely followed the 10-yr T-note. If you look at a graph of the difference for 2011 (T-note rate minus TIPS rate), you don’t see this earthquake at all.
A negative real yield of 10-yr T-note??? Macro economists were saying in 2009 that real rates should be negative. So the question should be, why did it take two years for the economy to react as theory said it should have. But perhaps two years is a quick response. If this turns into a “lost decade”, a la Japan, future historians may just ignore the lag between the financial bubble popping and real rates turning negative.