
As stock markets wavered violently over the last week, the market for Treasury Inflation-Protected Securities has been remarkably sedate, and surprisingly, there is no apparent demand for TIPS as a ‘safe harbor.’
This chart shows the 5-day market results for TIPS, represented by the TIP ETF in blue, versus the overall stock market, represented by the SPY ETF in red:
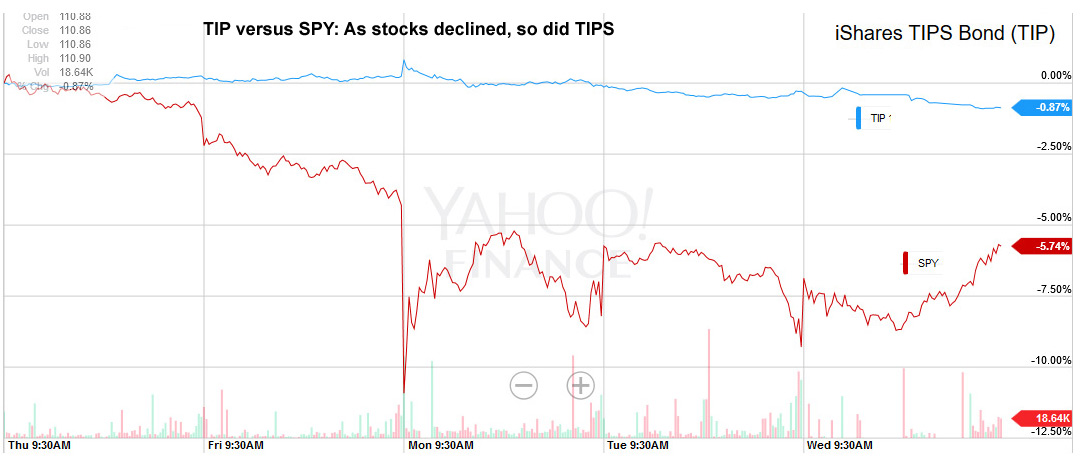
This is surprising because TIPS for years have been the safe harbor investment of choice: 1) for safety, and 2) for inflation protection against possible monetary moves to stimulate the markets.
Remember the last correction? It had been more than four years since the stock market suffered a decline of more than 10%. In fact, the last stock market correction – which began in July 2011 – was the starting point for an explosion in the value of TIPS, pushing yields negative to inflation for years. I wrote about this in my April 25, 2103, article titled, ‘The TIPS earthquake: When did it happen, and why?’
That article included this chart, showing the huge move up for Treasurys and TIPS which began at the exact moment the stock market plummeted (oddly enough, in reaction to Standard & Poors downgrading US Treasurys):
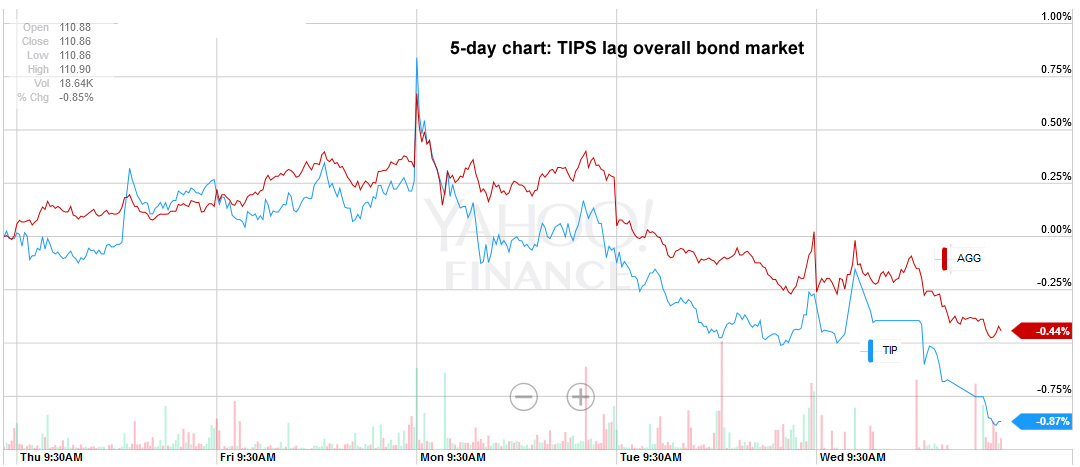
You can see in that chart that TIPS greatly outperformed the overall bond market for the remainder of 2011 (represented by the AGG ETF in red). But this time – the 2015 correction – that isn’t happening. As the stock market plummeted this week, TIPS values actually declined. And this chart shows that TIPS aren’t out-performing the overall bond market:
A final thing to note: TIPS have also been lagging the overall Treasury market, meaning that inflation breakeven rates have been falling over the last week. That happens when TIPS yields rise more than Treasury yields. Here are the numbers:
| 5-year TIPS | 5-year Treasury | Breakeven | |
| Aug. 19 | 0.33 | 1.50 | 1.17 |
| Aug. 26 | 0.36 | 1.49 | 1.13 |
| 10-year TIPS | 10-year Treasury | Breakeven | |
| Aug. 19 | 0.55 | 2.12 | 1.57 |
| Aug. 26 | 0.65 | 2.18 | 1.53 |
| 30-year TIPS | 30-year Treasury | Breakeven | |
| Aug. 19 | 1.06 | 2.81 | 1.75 |
| Aug. 26 | 1.22 | 2.94 | 1.72 |
Conclusion. What can we take from this? 1) That the market does not fear inflation and does not expect the Federal Reserve to rush in with economic stimulus, 2) That the market is viewing the current stock market volatility as a correction and not the beginning of a major bear market, and 3) that the market still believes higher interest rates are coming, if not in 2015, then early in 2016.
TIPS are not going to be the ‘safe harbor’ investment in 2015. If yields continue to climb, we could see buying opportunities.

MGK, true. But TIPS have been acting as an investment of choice in troubled markets since mid 2011, when the Federal Reserve began ‘Operation Twist’, which weakened the dollar and should have – in theory – brought higher inflation. Now it appears there will be no further Fed action, and the fear of inflation has waned. TIPS yields are again positive across all maturities. The 2008 plummet in TIPS values was caused by panic selling of all assets, plus the fear of massive deflation. That was a great buying opportunity. Maybe buying opportunities are in our future.
TIPS are only an investment of choice if you (foolishly) accept the government’s CPI (inflation) numbers. There are several good discussions of the government’s manipulation of the CPI to save money on Social Security payments, primarily. Fred Sheehan has written two books on Allan Greenspan and discusses this fraud thoroughly.
In short the CPI number understates the real inflation rate by at least 1%.
Flawed or not, real returns on all asset classes are calculated using the same CPI formula. So if “actual” CPI is higher than reported, that means you are also making less money on your stocks, bonds, and houses than you thought you were. It’s really no different from TIPS. To your second point, while I’m pretty suspicious of the the Boskin Commission’s motives myself, that fact is that TIPS were introduced primarily to lower the governments borrowing costs by capturing the inflation risk premium for the Treasury. It’s really not in their interest, therefore, to have an inaccurate measure of inflation, as this would be far more costly to the Treasury than whatever is was gained by cutting SSA COLA’s. The amount of borrowing far exceeds SSA payments.
To MGK’s response, I’d add that when you buy TIPS and I Bonds you are accepting that inflation is going to be determined by CPI-U. That is what you are buying, and that is what you are getting. So it’s not foolish, it’s just terms of the deal.
I’m pretty sure that TIPS are supposed to be uncorrelated with other asset classes. They did not do well during the 07-08 crash, whereas T-bonds soared in value.
I remember this, accurately I think.
In mid-January 2000, the Dow price peaked — not again reached on a real basis until November 2013.
In mid-January 2000, the 30 yr TIPS yield peaked — NOT since reached!
Might have been the same day ….?
Talk about correlating!
So, people are well-fooled, I reckon. (A common thought where I think!)
On 8/27/15, Treasury Inflation-Protected Securities
Actually, the 30 year TIPS real yield hit 1.2% yesterday, and I bought a little. Not the opportunity of a lifetime, but attractive. I think there is still illiquidity in TIPS. (LTPZ was down 1.96% yesterday.) I doubt we’ll see another Lehmann dump like we did in ’08 (which was the opportunity of a lifetime), but I could see episodes where the 30 year blips to 2% on panic days. Keep alert….