
Aug. 21 update: 30-year TIPS reopening gets real yield of 2.650%
By David Enna, Tipswatch.com
The U.S. Treasury on Thursday will offer $8 billion in a reopening auction of CUSIP 912810UH9, a 30-year Treasury Inflation-Protected Security. The auction, which will create a 29-year, 6-month TIPS, has the potential to set a multi-decade high for real yield.
This TIPS originally auctioned February 20, generating a real yield to maturity of 2.403%, the highest in 23 years for this term. Its coupon rate was set at 2.375%, also the highest for this term in 23 years.
CUSIP 912810UH9 trades on the secondary market. According to Bloomberg’s U.S. Yields, it closed Friday with a real yield of 2.65%, well above the February record. The U.S. Treasury is currently estimating the real yield of a full-term 30-year TIPS at that same number, 2.65%.
Definition: The “real yield to maturity” of a TIPS is its yield above official future U.S. inflation, over the term of the TIPS. So a real yield of 2.65% means an investment in this TIPS would provide a return that exceeds U.S. inflation by 2.65% for 29 years, 6 months.
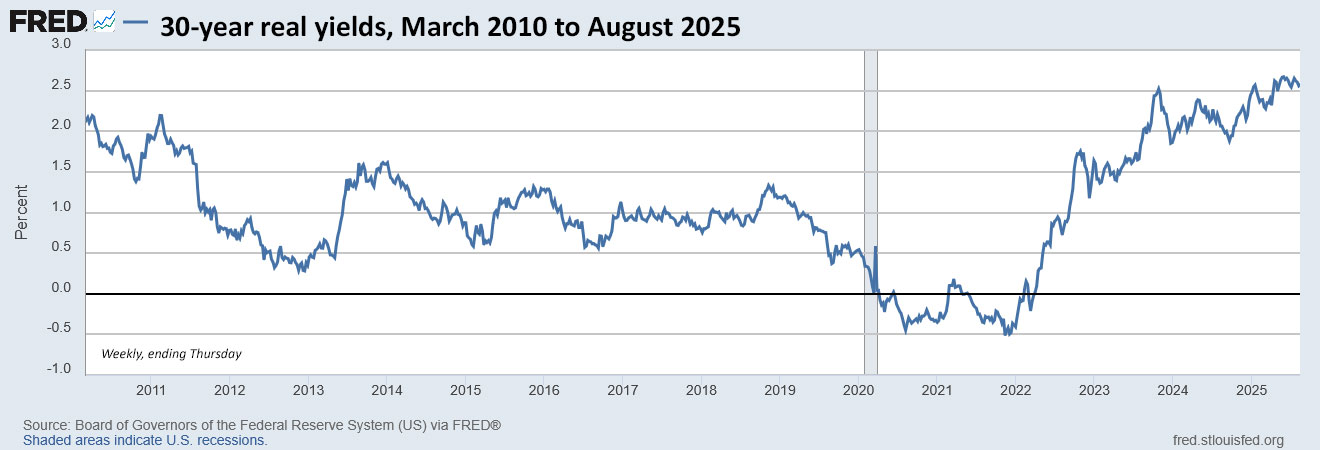
Reality check. When I talk about a nearly 24-year high, I have to note that the Treasury stopped offering 30-year TIPS from October 2001 to February 2010. Before 2001, auctioned real yields were much higher across all maturities of TIPS, which were very new and little understood at the time. These early TIPS were spectacular investment opportunities.

So what we are really looking at is the 15-year history of the 30-year TIPS since 2010, which is charted here and clearly shows that the above-inflation yield in August 2025 is historically significant:
Dangers of the 30-year term
My investment philosophy for TIPS is: buy and hold to maturity. For an investor with a 30-year time-frame — say someone aged 50 to 60 — this week’s TIPS auction should be attractive, potentially as the top rung of TIPS investment ladder. It should also be attractive for TIPS traders willing to bet that real yields will be declining in the future.
A 30-year TIPS is highly volatile. For example, a 30-year TIPS issued just three years ago — CUSIP 912810TE8 — auctioned with a real yield of 0.195% and a coupon rate of 0.125%. Today, that TIPS is trading with a real yield of 2.67% and a price of 51.90, meaning it has lost nearly 50% of its market value in three years.
(Side note: On the day of that 2022 auction, February 17, the 30-year Treasury bond had a nominal yield of 2.31%, less than real yield of similar TIPS today.)
That February 2022 30-year auction was potentially disastrous for investors who could not hold to maturity. This week’s auction is much more attractive, and offers some potential for capital gains for TIPS traders. But that would backfire if real yields continue rising.
Want to speculate? Go for it. My recommendation is always to buy a TIPS with the plan to hold to maturity.
Pricing
At Friday’s close CUSIP 912810UH9 was trading with a discounted price of 94.38 because the market real yield of 2.65% was above the coupon rate of 2.375%. This will likely change before the Thursday auction, but can give us an idea of pricing:
- Par value purchased: $10,000
- Inflation index on Aug. 29 settlement date: 1.02189.
- Actual principal purchased: $10,000 x 1.02189 = $10,218.90
- Cost of investment: $10,218.90 x 0.9438 = $9,644.60
- + accrued interest of about $9.23.
So in this scenario — meant to be an illustration — an investor would pay $9,644.60 for $10,218.90 in principal as of the settlement date of August 29. From then on, the investor would earn accruals matching future inflation, plus an annual coupon rate of 2.375% paid on inflation-adjusted principal for 29 years, 6 months.
Inflation breakeven rate
The 30-year Treasury bond closed Friday with a nominal yield of 4.92%, which means this TIPS at 2.65% would have an inflation breakeven rate of 2.27%, more or less in line with recent auctions of this term. This means it will out-perform the nominal Treasury if inflation averages more than 2.27% over the next 29 years, 6 months. (Inflation over the last 30 years, ending in July, has averaged 2.5%.)
My quick impression is that a 30-year nominal approaching 5% is pretty attractive. But I’d still prefer the inflation-protection that comes with the TIPS. Here is the trend in the 30-year inflation breakeven rate over the last 15 years:
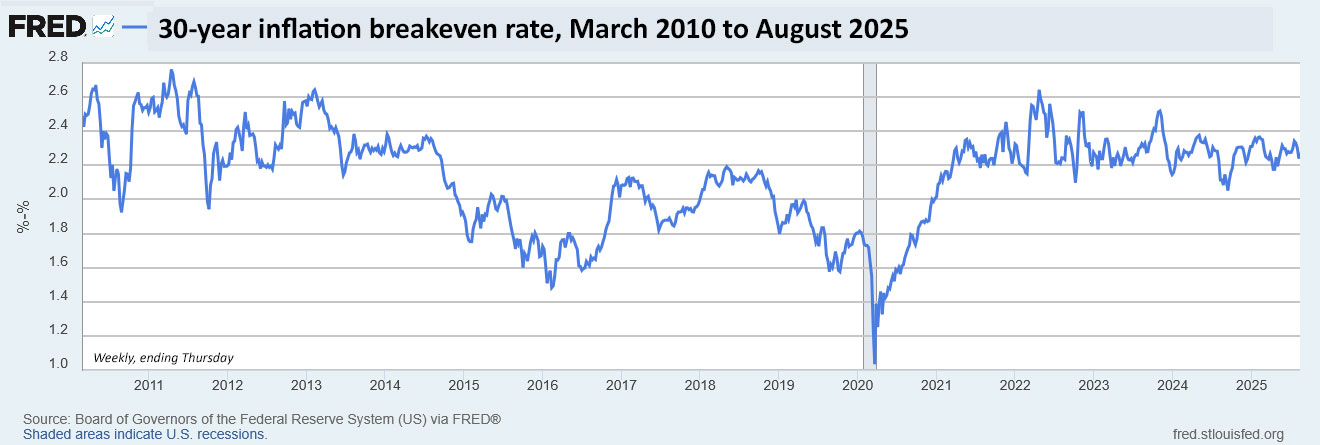
This chart is historically stunning, in my opinion, with 30-year inflation expectations waffling between 2.2% to 2.4% for nearly four years. This seems to be a remarkably consistent view of future inflation — which probably means it will be wrong.
Thoughts on the auction
There is no particular reason to wait for Thursday’s auction to purchase CUSIP 912810UH9 unless you want to buy a small amount at TreasuryDirect. If you have access to a major brokerage, this TIPS is trading on the secondary market and can be purchased any time you see a real yield you like.
The advantage of buying at auction, especially through TreasuryDirect, is that even small-lot purchases will get the auction’s high yield. The advantage of the secondary market is that you can see exactly the price and real yield you will be receiving. The negative is that you may face a small bid-ask spread. Most of the time, it doesn’t make a huge difference, but if you see a real yield you like, know that you can probably get it on the secondary market without dealing with the auction’s uncertainty.
I won’t be a buyer because my TIPS ladder tops out in 2043, when in theory I will be 90 years old. I don’t think I need to extend beyond that year.
For the right buyer with a true plan to hold to maturity, I think CUSIP 912810UH9 looks like a solid investment. As always, do your own research.
This TIPS auction closes Thursday at 1 p.m. ET. Non-competitive bids at TreasuryDirect must be placed by noon Thursday. If you are putting an order in through a brokerage, make sure to place your order Wednesday or very early Thursday, because brokers cut off auction orders before the noon deadline.
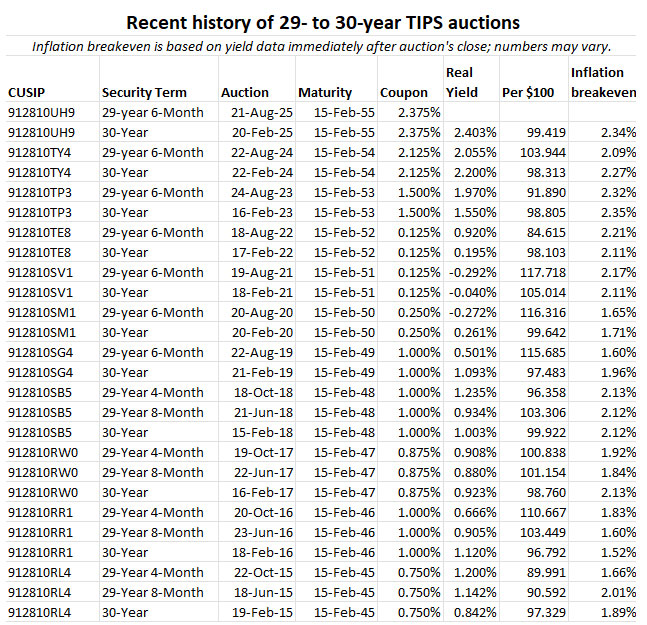
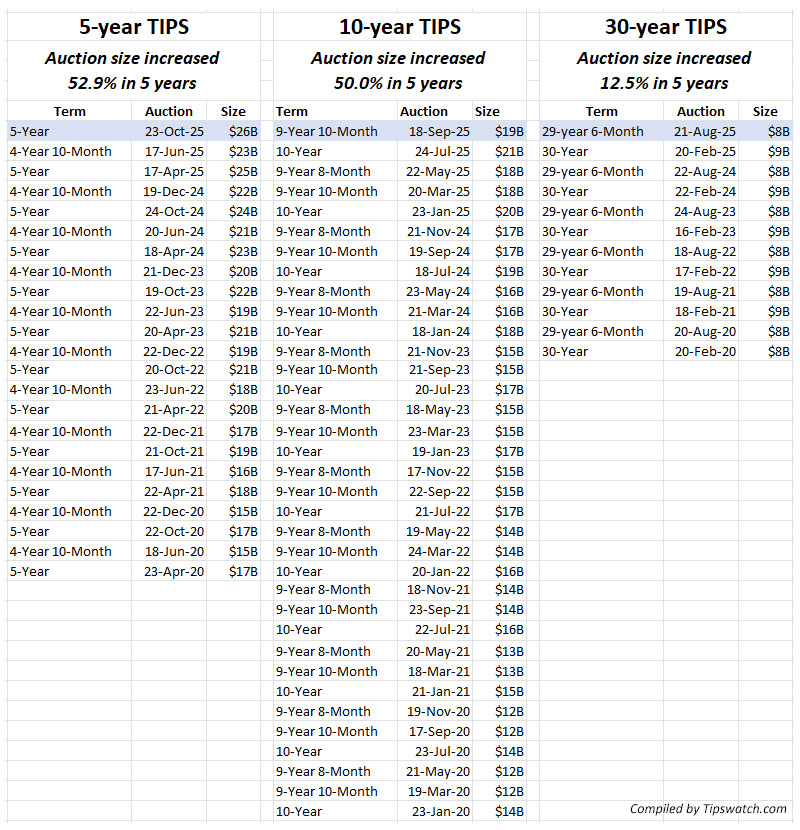
Here is a history of auctions of this term over the last 10 years:
• Now is an ideal time to build a TIPS ladder
• Confused by TIPS? Read my Q&A on TIPS
• TIPS in depth: Understand the language
• TIPS on the secondary market: Things to consider
• TIPS investor: Don’t over-think the threat of deflation
• Upcoming schedule of TIPS auctions
—————————

Donate? This site is free and I plan to keep it that way. Some readers have suggested having a way to contribute. I would welcome donations. Any amount, or skip it, your choice. This is completely optional.
—————————
Follow Tipswatch on X for updates on daily Treasury auctions and real yield trends (when I am not traveling).
Feel free to post comments or questions below. If it is your first-ever comment, it will have to wait for moderation. After that, your comments will automatically appear. Please stay on topic and avoid political tirades. NOTE: Comment threads can only be three responses deep. If you see that you cannot respond, create a new comment and reference the topic.
David Enna is a financial journalist, not a financial adviser. He is not selling or profiting from any investment discussed. I Bonds and TIPS are not “get rich” investments; they are best used for capital preservation and inflation protection. They can be purchased through the Treasury or other providers without fees, commissions or carrying charges. Please do your own research before investing.


Dongchen, I always say that the inflation breakeven rate reflects sentiment but is a fairly lousy predictor of future inflation.…