

By David Enna, Tipswatch.com
I am writing this from a hotel room in Kyoto, Japan, 14 hours ahead of Eastern Standard Time. Today is Friday. I believe it is also Friday (but very early) in the United States.
After 43 days of political nonsense, the U.S. government shutdown has now ended, which means I probably will be able to fly home next week. It also means that collecting very important economic statistical data can begin again.
The White House said this week that September and October jobs reports may never be released, even though data were collected for September before the shutdown. The same is true for the October inflation report, since no price data was collected for that month.
White House press secretary Karoline Leavitt announced this while taking one last shot (actually, probably not the last) at Democrats. From Politico:
“Democrats may have permanently damaged the federal statistical system with October CPI and jobs reports likely never being released,” Leavitt told reporters. “All of that economic data released will be permanently impaired, leaving our policy makers at the [Federal Reserve] flying blind at a critical period.”
Kevin Hassert, President’s Trump’s top economic adviser, later clarified that October jobless data will eventually be released, but without an official unemployment rate figure. “That’ll be for just one month,” he said.
The inflation report
Since no price data were collected last month, there is no way to produce a conventional inflation report for October. Nevertheless, a sort-of-official calculated CPI number will have to be announced, and soon, because that will determine inflation accruals for Treasury Inflation-Protected Securities in December, just 17 days away.
Those daily inflation indexes (such as these for November) are crucial for pricing TIPS in the secondary market. Without some sort of index, traders won’t be able to value TIPS accurately. And since we will be getting a calculated CPI estimate, the TIPS market is going to feel some turbulence.
The Bureau of Labor Statistics has posted this note on its site:
BLS will announce revised news release dates on this page as they become available. We appreciate your patience while we work to get this information out as soon as possible, as it may take time to fully assess the situation and finalize revised release dates.
Without the October inflation report the Treasury will probably rely on a calculated non-seasonally adjusted inflation number for October, as noted in the Code of Federal Regulations.
If the CPI-U for a particular month is not reported by the last day of the following month, we will announce an index number based on the last 12-month change in the CPI-U available. Any calculations of our payment obligations on the inflation-indexed savings bonds that rely on that month’s CPI-U will be based on the index number that we have announced.
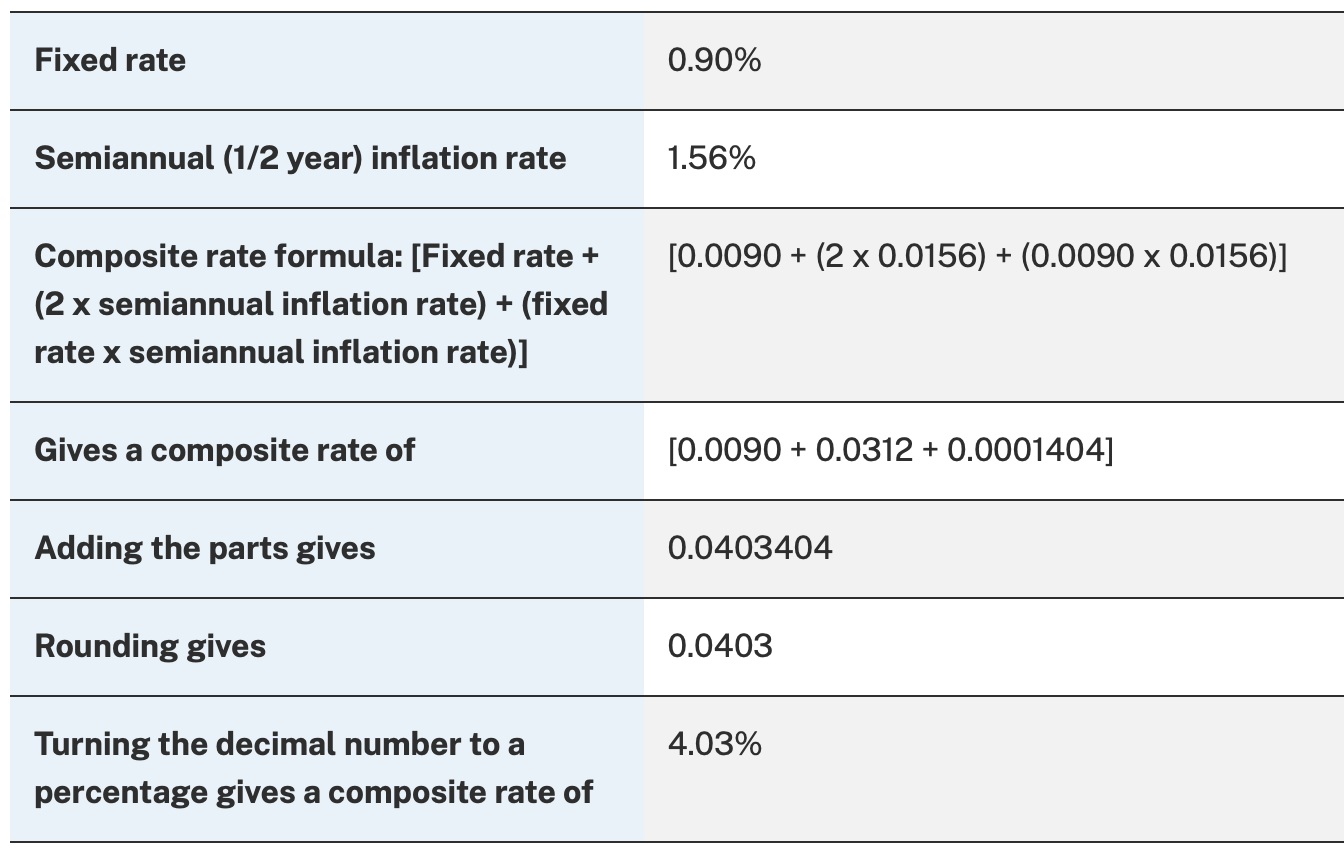
The exact formula is a bit complicated for a lowly journalist, as you can see here:
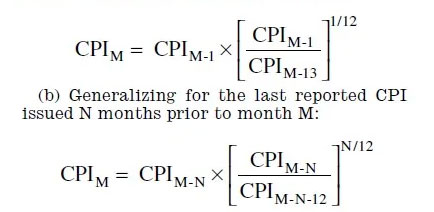
I am going to guess the October inflation number will end up being around 0.25% based on this 12-month calculation. The October CPI index should be something around 325.6. We’ll see.
The BLS or Treasury will need to announce something soon because the TIPS market will get shaken without data on future market values.
In a report on October 25, Bloomberg speculated on unease in the TIPS market because of potentially inaccurate inflation indexes in December:
The segment of the US Treasury market that offers investors protection against rising consumer prices is headed for uncharted waters …
Jonathan Hill, head of US inflation strategy at Barclays Capital Inc., said the lack of data or questionable data will create stresses in the TIPS market:
If the October CPI isn’t published by the end of November, “the fallback comes into effect,” not just for TIPS but also for inflation swaps, derivative contracts in which a floating interest rate is exchanged for a CPI-based payment, Hill said. “It’s something that’s never come into effect before.”
Even if the data are published on time, doubts about its quality may create volatility, Hill said. …
Interest-rate strategists at Morgan Stanley said in a report this week that “concerns over deteriorating CPI data quality” related to “weaker data collection amid the government shutdown may be weighing on investor demand” for the $2 trillion TIPS market.
It’s worth noting that the real yield of a 10-year TIPS has been holding fairly steady during this shutdown crisis — falling from 1.87% on September 2 to 1.83% at the close on Thursday. During that same period, the nominal yield of a 10-year Treasury note fell from 4.28% to 4.11%. So it is possible that uneasiness over accurate inflation accruals is having an effect on the TIPS market.
Thursday’s reopening auction of a 10-year TIPS — CUSIP 91282CNS6 — should give us some idea of market demand. I plan on posting a preview to that auction sometime on Sunday (or whatever time it is in Japan).
Eventually, when the November and December inflation reports are released based on standard collection of data, the inflation numbers should return to accuracy. This should be — we hope – only a temporary disruption of the TIPS market.
But the continuing resolution only extends government funding to January 30. Will this damaging game start again in 2026?
—————————

Donate? This site is free and I plan to keep it that way. Some readers have suggested having a way to contribute. I would welcome donations. Any amount, or skip it, your choice. This is completely optional.
—————————
Follow Tipswatch on X for updates on daily Treasury auctions and real yield trends (when I am not traveling).
Feel free to post comments or questions below. If it is your first-ever comment, it will have to wait for moderation. After that, your comments will automatically appear. Please stay on topic and avoid political tirades. NOTE: Comment threads can only be three responses deep. If you see that you cannot respond, create a new comment and reference the topic.
David Enna is a financial journalist, not a financial adviser. He is not selling or profiting from any investment discussed. I Bonds and TIPS are not “get rich” investments; they are best used for capital preservation and inflation protection. They can be purchased through the Treasury or other providers without fees, commissions or carrying charges. Please do your own research before investing.


Thank you Fred Bloggs for this coherent analysis, without undertones of personal agendas... a rarity on the modern www. It…