
By David Enna, Tipswatch.com
The Treasury’s auction of $9 billion in a new 30-year Treasury Inflation-Protected Security — CUSIP 912810US5 — generated a real yield to maturity of 2.473%, the second-highest yield since the 30-year term was restarted in February 2010.
Demand appeared to be strong. The “when-issued” yield prediction released just before the close was 2.49%, so investor bids were strong enough to lower the real yield. The bid-to-cover ratio was 2.75, also an indication of strong demand.
The auction result set the coupon rate at 2.375%, matching a 16-year high.
Definition: The “real yield to maturity” of a TIPS is its yield above official future U.S. inflation, over the term of the TIPS. So a real yield of 2.473% means an investment in this TIPS would provide a return that exceeds U.S. inflation by 2.473% for 30 years.
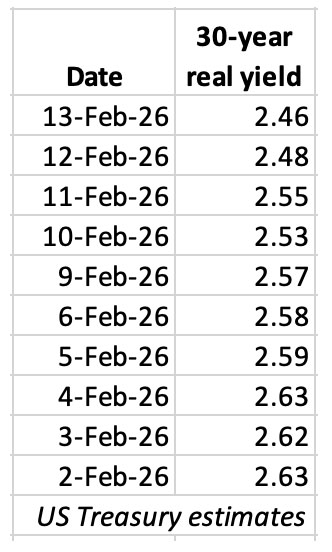
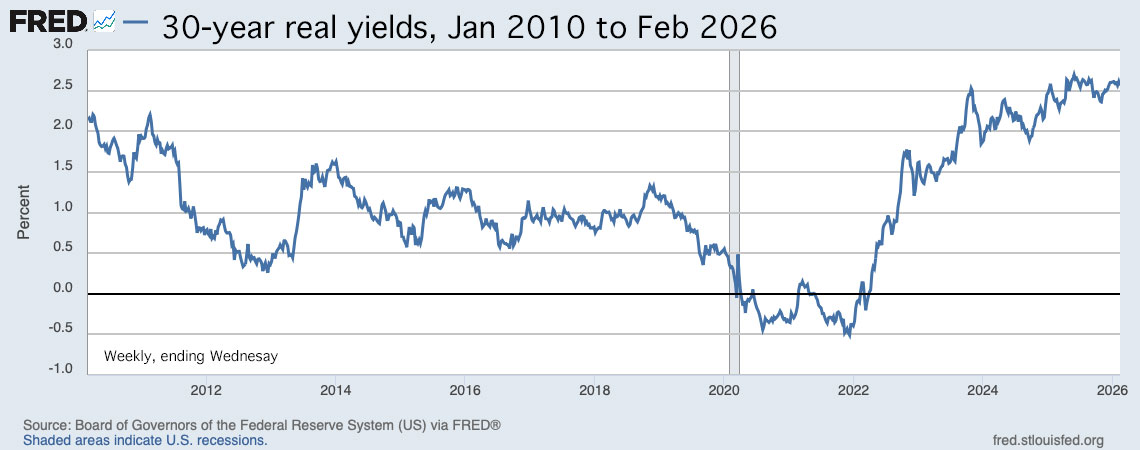
Overall, this looks like a great result for small-scale investors, especially those committed to holding for the full 30-year term. Here is the trend in the 30-year real yield over the last 2 years:
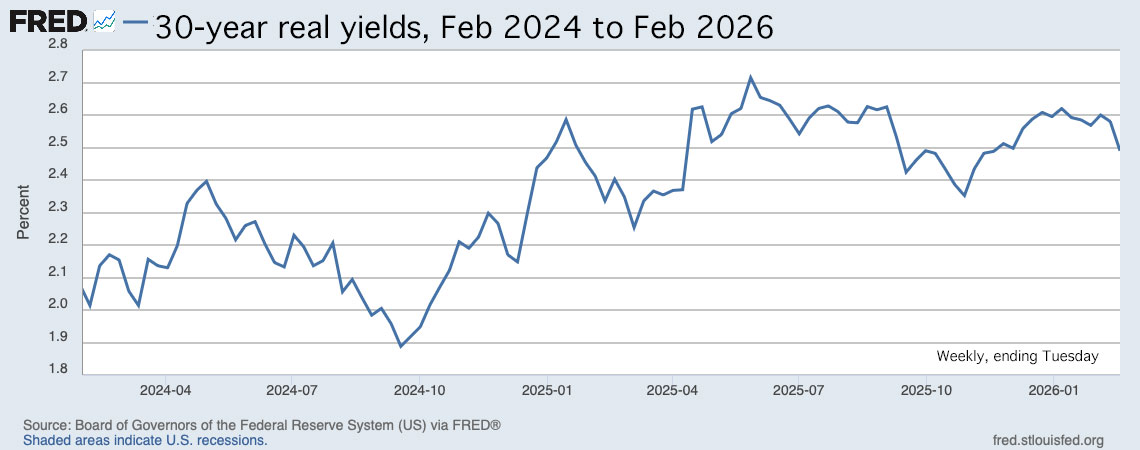
While real yields have dipped a bit in recent weeks, today’s real yield of 2.473% remains historically attractive. This is the first TIPS ever issued to mature in 2056.
Pricing
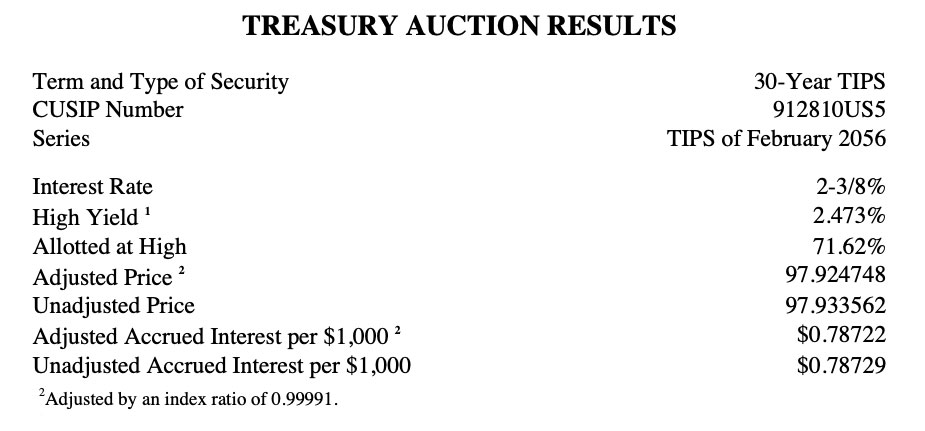
Because the coupon rate was set below the auction’s real yield, investors got this TIPS at a discounted price of 97.933562. In addition, this TIPS will carry an inflation index of 0.99991 on the settlement date of February 27. With that information, we can calculate the cost of an investment of $10,000 par value:
- Par value: $10,000.
- Principal at settlement date: $10,000 x 0.99991 =$9,999.10.
- Cost of investment: $9,999.10 x 0.97933562 = $9,792.47
- + accrued interest of $7.72
In summary, an investor purchasing $10,000 par value of this TIPS will pay $9,792.47 on the settlement date for $9,999.10 of principal. (The principal is reduced because of slight deflation in the month of December.)
Inflation breakeven rate
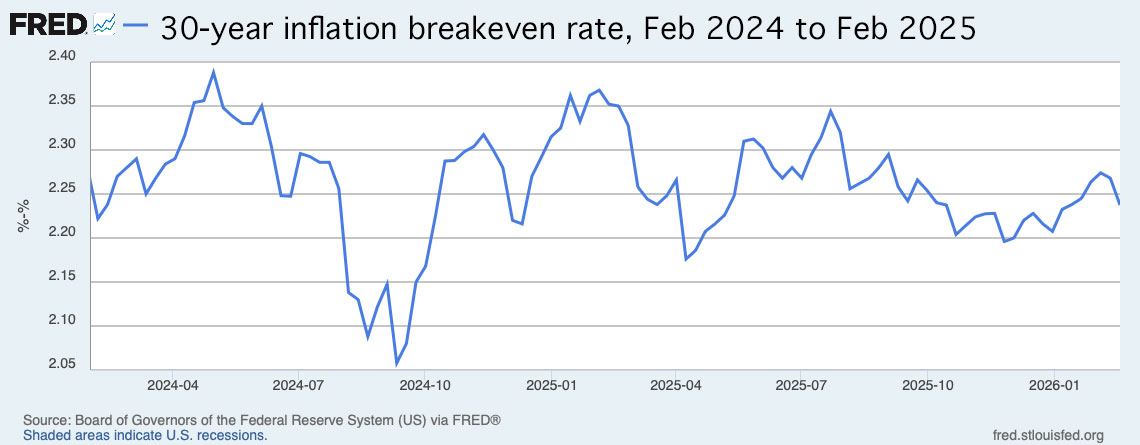
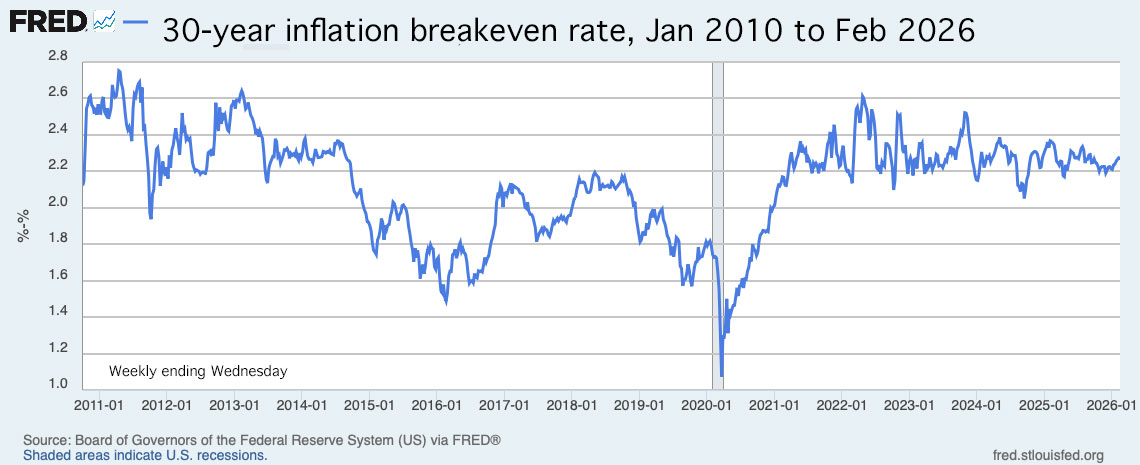
At the exact time of the auction’s close I was asleep in northern Australia (15 hours ahead of EST), but two hours later the 30-year Treasury bond was trading with a nominal yield of 4.70%. We’ll go with that, creating a 30-year inflation breakeven rate of 2.23%, which seems reasonable. This means the TIPS will out-perform a 30-year bond if inflation averages more than 2.23% over the next 30 years.
Here is the trend in the 30-year inflation breakeven rate over the last two years, showing that this auction fell into the mid-range of inflation expectations:
Thoughts
This looks like a solid auction result for both small-scale investors and the Treasury. Demand appeared to be strong, but the real yield remained historically attractive.
It’s impossible to predict (or even troubling to think about) where both real and nominal yields could be heading for longer-term issues. The U.S. debt continues climbing, while at the same time confidence in the Federal Reserve and U.S. dollar is waning.
Real yields could plummet if the U.S. economy sinks and a future Federal Reserve reignites bond-buying quantitative easing. Or, real yields could continue rising. Impossible to say. This TIPS, however, will offer inflation protection for 30 years, along with an attractive coupon rate of 2.375% paid on inflation-adjusted principal.
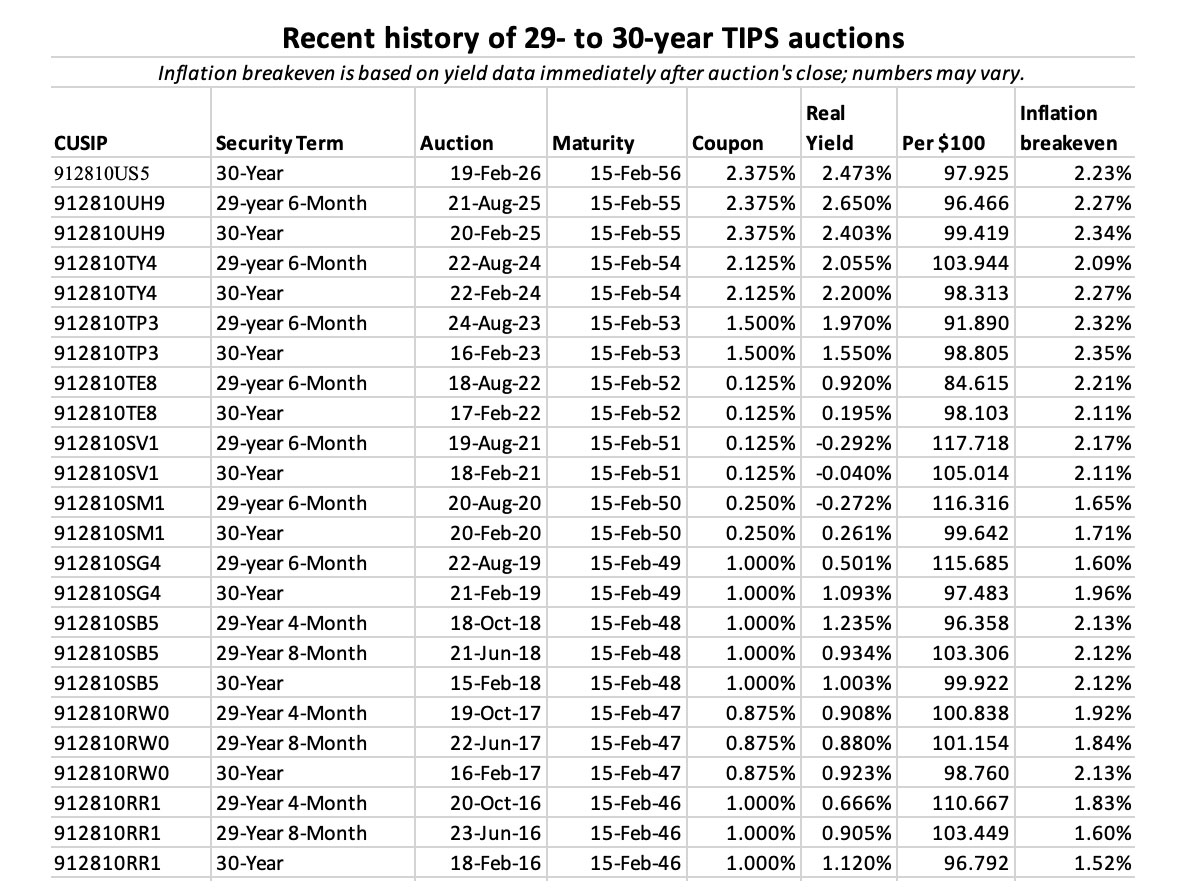
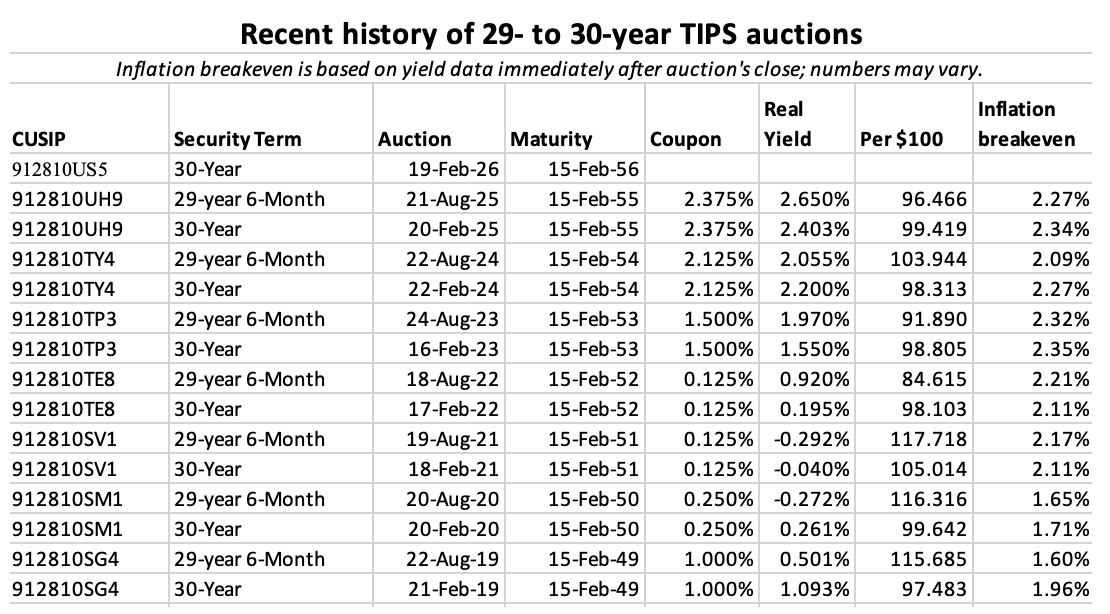
For the right investor, this looks like a solid investment. Here is the auction history for this term over the last 10 years:
• Now is an ideal time to build a TIPS ladder
• Confused by TIPS? Read my Q&A on TIPS
• TIPS in depth: Understand the language
• TIPS on the secondary market: Things to consider
• TIPS investor: Don’t over-think the threat of deflation
• Upcoming schedule of TIPS auctions
—————————

Donate? This site is free and I plan to keep it that way. Some readers have suggested having a way to contribute. I would welcome donations. Any amount, or skip it, your choice. This is completely optional.
—————————
Follow Tipswatch on X for updates on daily Treasury auctions and real yield trends (when I am not traveling).
Feel free to post comments or questions below. If it is your first-ever comment, it will have to wait for moderation. After that, your comments will automatically appear. Please stay on topic and avoid political tirades. NOTE: Comment threads can only be three responses deep. If you see that you cannot respond, create a new comment and reference the topic.
David Enna is a financial journalist, not a financial adviser. He is not selling or profiting from any investment discussed. I Bonds and TIPS are not “get rich” investments; they are best used for capital preservation and inflation protection. They can be purchased through the Treasury or other providers without fees, commissions or carrying charges. Please do your own research before investing.


Thank you Fred Bloggs for this coherent analysis, without undertones of personal agendas... a rarity on the modern www. It…