
By David Enna, Tipswatch.com
Editor’s note: This is an updated version of an article I first wrote in 2017 and revised in 2021.
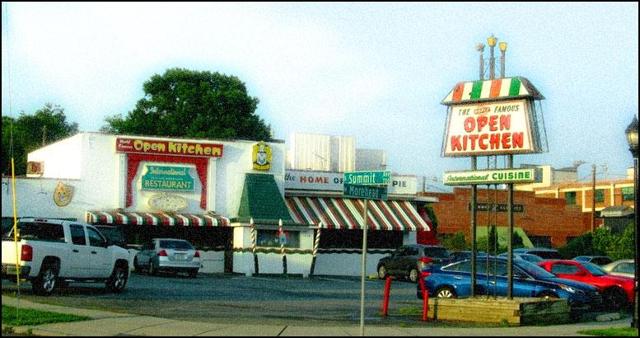
There’s a restaurant in my hometown – Charlotte, N.C. – that has been in business continuously at the same location on West Morehead Street since 1952. The restaurant business draws a notoriously fickle clientele, so that’s pretty remarkable.
The Open Kitchen was founded by Steve Kokenes, who was Greek, not Italian. His menu of pizza, lasagna, spaghetti and other “international” cuisine was a rarity for Charlotte in those days. The city didn’t get an authentic Italian restaurant – meaning, run by actual Italians – until the late 1980s. But that didn’t matter; the Open Kitchen specialized in simple, tasty comfort food and it prospered.
The restaurant expanded in the 1960s and 1970s. An interesting side note is that its location — once a dreary area of warehouses and factories — is now a booming area of modern apartments, art galleries, trendy breweries and “artisan” restaurants, very close to Bank of America Stadium. It’s now a very valuable piece of property. But the Open Kitchen is still there, still consistently serving “comfort food” to a loyal clientele.
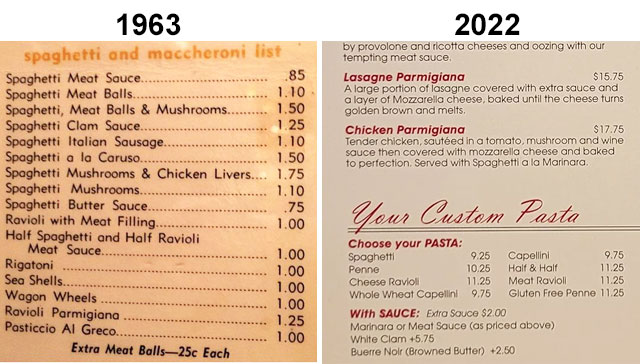
The restaurant is still run by members of the Kokenes family, who wait tables and run the cash register. And they have a remarkable collection of Charlotte memorabilia displayed all over the walls. But what really caught my attention on a past visit was a 1963 menu posted by the entrance to the dining room. It’s especially interesting since today’s menu contains many of the same items – with exactly the same names – 59 years later. Aha! This offers a unique look into inflation over the last 59 years, and … what could be in store for our future.
Where were you 59 years ago?
Back in 1963, $1 was worth … well, one dollar. And that is still true today. But adjusted for inflation (based on the Bureau of Labor Statistics’ Inflation Calculator) it takes $9.68 in today’s dollars (up from $8.89 last year, which is depressing) to equal the buying power of $1 in July 1963. That is an increase of 868%, and it is my baseline for comparisons of price changes from 1963 to today.
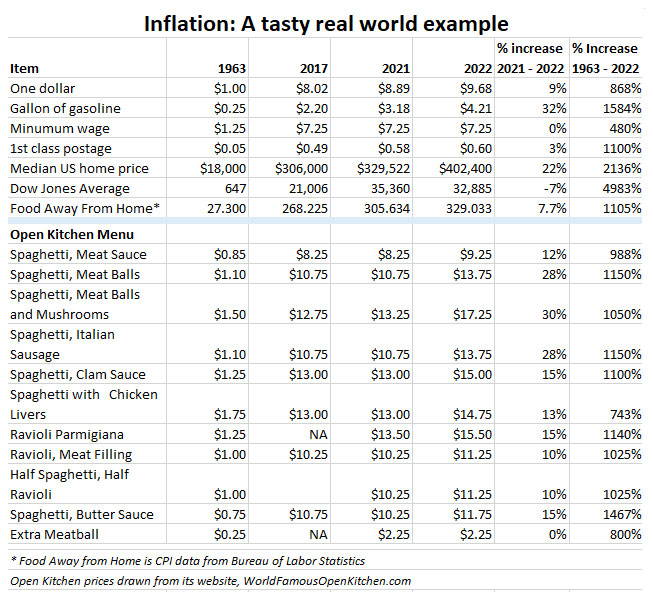
Anyone who drove a car before the 1973 gas crisis fondly remembers gasoline at 25 cents a gallon. That’s what it was selling for back in 1963. But in reality, gas prices until a couple years ago were as cheap (relatively speaking) as they were in 1963. However, even after dipping a bit this month, gas prices have almost doubled in the last five years and the cost of gasoline has now surged 1,584% since 1963, much higher than the rate of overall inflation.
And look at the median U.S. home sales price – $402,400 in 2022 – up 22% over the last year and 2,136% since 1963. Home prices have been running well above inflation. Same with the stock market, which has endured four bear markets in the last 22 years and yet is up 4,983% since 1963, nearly six times inflation.
At the same time, the U.S. minimum wage at $7.25 has lagged well behind inflation. At this point, I think, the minimum wage is an archaic idea that should be set to a realistic number ($15 an hour? $18?) and indexed to inflation, or simply abandoned.
The Open Kitchen: Then, and now
I included the Bureau of Labor Statistic’s Food Away From Home index in the chart, which should give you a realistic idea of restaurant price increases over the years. That index was up 7.7% in the last year and 1,105% over the last 59 years.
But the Open Kitchen is an interesting case study. When I did an update to this story last year, many of its prices were still very close to or the same as their 2017 levels. But in 2022, its typical prices have increased at a rate of 11% to 15%, more than the overall restaurant industry. That is realistic since it held prices close to stable from 2017 to 2021.
For example, Spaghetti with Meat Balls and Mushrooms (one of my favorite Open Kitchen offerings) costs $17.25 today versus $1.50 in 1963, a 1,050% increase that is very close to the overall Food At Home index increase of 1,105%. But the price popped up 30% in the last year, bringing it to a more realistic level, I assume.
There are a few bargains on the list: An extra meatball, for example, costs $2.25 today, same as last year, and 800% more than the 1963 cost of 25 cents. That 800% increase is lower than overall U.S. inflation and the Food at Home index. (Waiter: Extra meatball, please!)
Want the more exotic Ravioli Parmigiana? That will cost you 1,140% more than it did in 1963, and probably destroy any hope you had of maintaining your diet. Want half spaghetti, half ravioli? (Good choice.) That will cost you $11.25 and I’d say that’s a bargain, but the price is 1,025% higher than the 1963 cost. So, dang, not really a bargain.
One clear bargain is Spaghetti with Chicken Livers, which now goes for $14.75, versus a rather pricey $1.75 in 1963. That’s an increase of 743%, well below the rate of overall inflation. (This dish is now relegated to very fine print at the bottom of the current menu. Understandable.)
The Open Kitchen also offers a new dish, “Chicken Livers Greque,” with this awesome description:
Plump, juicy chicken livers sauteed in butter, delicately seasoned with oregano and lemon. Served with garden salad and French fries. ($15.50 … <up from $13.50 a year ago>)
I imagine that The Open Kitchen doesn’t sell a lot of Spaghetti with Chicken Livers or Chicken Livers Greque, but it’s a testament to their sense of tradition that they keep these on the menu.
A real world example, in our lifetimes
If you were alive in 1963 — I was 10 years old then — you and I have seen U.S. inflation rise 868% in the last 59 years. Gasoline costs are up more than 1,500%. A typical American home now goes for $402,000 versus $18,000 in 1963.
Inflation is an unrelenting force. I look at today’s Open Kitchen prices and my reaction is “perfectly reasonable.” But imagine if you saw these prices in 1968. You’d have been stunned. Now, imagine the prices you could be seeing in 20, 30, 40 years.
Inflation is dangerous. It’s a force that must be considered.
Another real world example
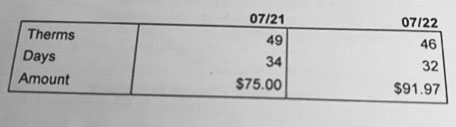
This week I received my natural gas bill for July. The cost was $91.97, which was 22.6% higher than the July 2021 bill. A year ago, in July 2021, we used more therms (49 vs. 46) and the bill was for more days (34 vs. 32), and even with that … the 2022 bill was 22.6% higher.
This is inflation. I can pay this bill. But a lot of people can’t handle a 22% increase in a basic cost of life.
Note: If you know young people who fail to understand and fear the force of inflation, please share this article with them. This all happened in our lifetimes. It will continue throughout their lifetimes.
* * *
Feel free to post comments or questions below. If it is your first-ever comment, it will have to wait for moderation. After that, your comments will automatically appear.
David Enna is a financial journalist, not a financial adviser. He is not selling or profiting from any investment discussed. The investments he discusses can be purchased through the Treasury or other providers without fees, commissions or carrying charges. Please do your own research before investing.


Thanks for the detailed explanation. I believe you are saying the "breakeven inflation rate" should reflect the inflation expectation rather…