
Annual inflation is now running at the hottest pace since 1981.
By David Enna, Tipswatch.com
Have we hit peak inflation yet? The answer is: we don’t know, because the June inflation report showed inflation surging ever higher, greatly exceeding already lofty expectations.

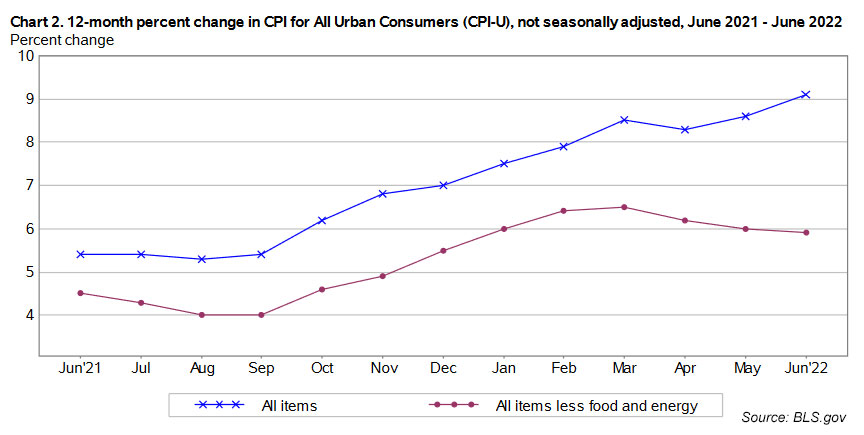
The Consumer Price Index for All Urban Consumers increased 1.3% in June on a seasonally adjusted basis, the U.S. Bureau of Labor Statistics reported today. Over the last 12 months, the all-items index increased 9.1%, the largest 12-month increase since November 1981. These results were much higher than economist expectations, which called for 1.1% for the month and 8.8% year over year.
Core inflation, which eliminates food and energy, also exceeded expectations, rising a disturbing 0.7% for the month (versus a consensus of 0.5%) and 5.9% year over year (versus an expected 5.8%). This surge in core inflation indicates the broad-based nature of U.S. inflation, which looks likely to continue running hot even if gas prices start falling.
The BLS noted that June price increases struck “almost all major component indexes.” Some highlights:
- Food at home costs increased 1.0% for the month, after rising 1.4% in May, and are now up 12.2% year over year. The dairy index rose 1.7% in the month, following a 2.9% increase in May. The sole food group to show a decline was meats and poultry, falling 0.4% in the month.
- Gasoline prices surged 11.2% in June, and were up 59.9% over the last year. This trend seems to have reversed in July, with gas prices falling a bit throughout the month, so far.
- The overall energy index rose 41.6% over the last year, the largest 12-month increase since the period ending April 1980.
- Shelter costs increased 0.6% in June and are up 5.6% for the year.
- The rent index rose 0.8% over the month, the largest monthly increase since April 1986.
- Prices for used cars and trucks continued climbing, up 1.6% for the month.
- Apparel prices surged 0.8% for the month and are up 5.2% for year.
- The medical care index rose 0.7% in June, and is up 4.8% for the year.
- Airline fares fell 1.8% in June after increasing strongly over recent months.
My overall impression is that, yes, U.S. inflation may have peaked in June because we could see gasoline prices begin to fall the rest of the summer. But clearly, even if the annual inflation rate begins to inch down from 9.1%, prices will continue to rise across the economy. Don’t be fooled by any claim in coming months that “inflation is under control.”
Here is the 12-month trend for both all-items and core inflation, showing that core inflation has started to stabilize at close to 6%, an unacceptably high rate:
What this means for TIPS and I Bonds
Investors in Treasury Inflation-Protected Securities and U.S. Series I Savings Bonds are also interested in non-seasonally adjusted inflation, which is used to adjust principal balances for all TIPS and set future interest rates for I Bonds. For June, the BLS set the inflation index at 296.311, an increase of 1.37% over the May number.
For TIPS. The June inflation index means that principal balances for all TIPS will increase 1.37% in August, after rising 1.1% in July. For the year ending in August, inflation accruals will have totaled 9.1%. Here are the new August Inflation Indexes for all TIPS.
For I Bonds. The June inflation report is the third in a six-month string — March to September — that will determine the I Bond’s new variable rate, which will be reset November 1. After three months, inflation has increased 3.06%, which would translate to a variable rate of 6.12%. But three months remain, and a lot can happen in three months, especially summer months when inflation is very hard to predict. The I Bond’s current variable rate is 9.62%.
Here are the numbers so far:

What this means for the Social Security COLA
The June inflation report sets a baseline figure for next year’s cost-of-living adjustment for Social Security, but the Social Security Administration uses a different index, Consumer Price Index for Urban Wage Earners and Clerical Workers (CPI-W). For June, CPI-W was set at 292.542, a year-over-year increase of 9.8%.
Does that mean Social Security benefits will increase 9.8% in January? No. the SSA uses the average of CPI-W over the months of July, August and September to determine the next year’s increase. Last year’s three-month average was 268.421, so at this point the increase would be 9.0%. That’s not a projection, because inflation should continue rising through the summer. But it is a starting point. I will be tracking these numbers on my Social Security COLA page.
What this means for future interest rates
I suspect that the Federal Reserve was prepared for this rather disturbing June inflation report, and will move forward with plans to increase short-term interest rates 75 basis points at it July 26-27 meeting, and then possibly again in September.
As we have seen in recent weeks, the Fed can move short-term rates higher, but has no real control over longer-term rates, which have been declining on recession fears. The nominal yield curve has flattened, with the 1-year Treasury trading at 3.18%, the 2-year at 3.18%, the 5-year at 3.11% and the 10-year at 3.02%.
Real yields on TIPS have been holding up nicely, with the 5-year now at 0.53% and the 10-year at 0.65%. I am thinking next week’s auction of a new 10-year TIPS will be a decent buying opportunity.
I wouldn’t be surprised if inflation moderates in the next few months, but continues at a historically high range. The economy is likely to weaken, and the Fed will be under pressure to “declare victory” and stop the rate hikes.
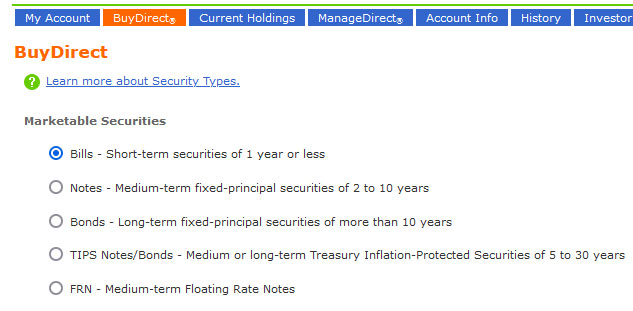
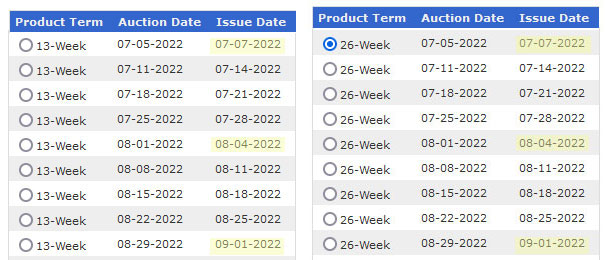
My conclusion: Take advantage of attractive short-term rates (about 2.2% on a 13-week Treasury) and continue to lock in attractive real yields on TIPS. Yes, rates are likely to go higher, but there is always the threat of the Fed backing off and intervening in a weakening economy. We’ve seen it before.
* * *
Feel free to post comments or questions below. If it is your first-ever comment, it will have to wait for moderation. After that, your comments will automatically appear.
David Enna is a financial journalist, not a financial adviser. He is not selling or profiting from any investment discussed. The investments he discusses can be purchased through the Treasury or other providers without fees, commissions or carrying charges. Please do your own research before investing.
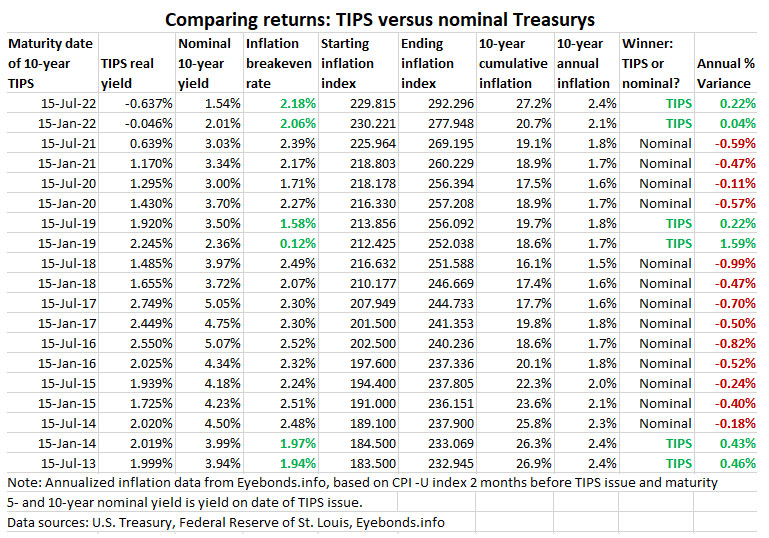


Thanks for the detailed explanation. I believe you are saying the "breakeven inflation rate" should reflect the inflation expectation rather…