
TIPS remain attractive. And now bank CDs are worth a serious look.
By David Enna, Tipswatch.com
It’s been kind of wild to go from seeing the possibility of TIPS with a real yield of 2% in early March to the possibility of 1% as we head into April.
The significant event in this downdraft came March 8, when Silicon Valley Bank announced a $1.8 billion loss on the sale of securities, including Treasury and mortgage bonds. The next day, shares of Silicon Valley Bank fell 60% and depositors began an social-media-fueled run on the bank.
The failure of SVB and Signature Bank led to a Federal Reserve bailout of non-protected depositors. And that bailout in turn fueled speculation that the Fed would soon pause its planned interest rate increases. But in the background, inflation still looms over the U.S. economy.
Here is the year-to-date trend for real yields on 5-, 10- and 30-year TIPS, along with the matching inflation breakeven rates:
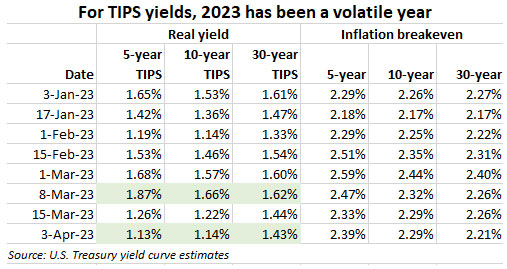
I’ve highlighted this year’s high for real yields, which came on March 8, and also the low, which came 19 days later on April 3. Inflation breakeven rates haven’t been greatly affected by this turmoil, indicating that nominal yields have been tracking closely with real yields.
In the midst of this market turmoil, a 10-year TIPS was reopened at auction on March 23, getting a real yield to maturity of 1.182%, marking a drop of about 48 basis points in two weeks. Since then, real yields have continued falling.
Next up is a Treasury auction of a new 5-year TIPS on April 20. In just over a month, that upcoming auction has gone from looking stellar (real yield of 1.8%+) to looking just okay (real yield of around 1.13%). But a lot can happen in the next two weeks. I’ll be posting a preview article on that auction on Sunday, April 16.
I’ll point out that things continue to change quickly. Real yields appear to be heading even lower today.
What this all means
TIPS remain attractive. It’s painful to watch real yields decline right before you purchase a TIPS, but at this point real yields for TIPS remain above 1%. That’s a decent number given the ultra-low rates of the last dozen years. I’ll probably still be a buyer at the April 20 auction.

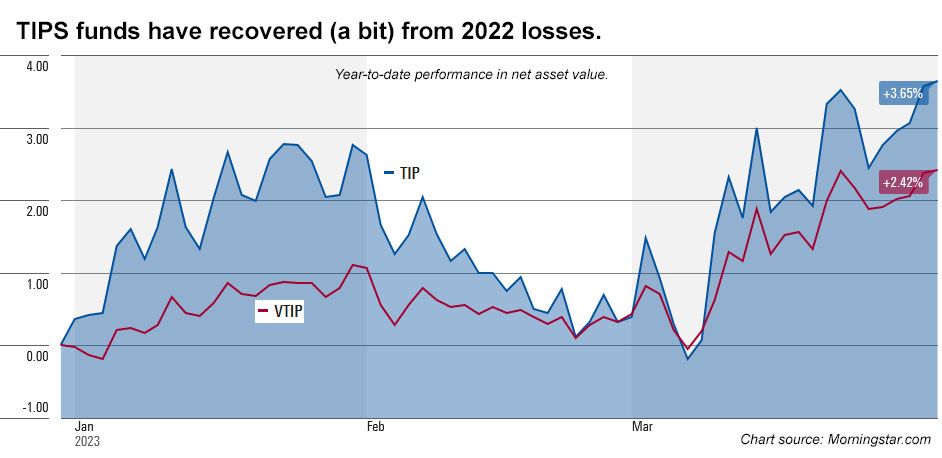
TIPS funds and ETFs are getting a boost. With markets anticipating a Fed rate slowdown, bond funds have been doing well in 2023. The broad-based TIP ETF is back above $110 (trading today at $110.66) after falling to as low as $104.96 last October. Holders of these TIPS funds can breathe a sigh of relief after a disastrous 2022.
Here is the year-to-date trend in the net asset values of the iShares TIPS Bond ETF and Vanguard’s Short-Term Inflation-Protected Securities ETF:
What about I Bonds? We are going to get a reset on both the fixed and variable rates for the U.S. Series I Savings Bond on May 1. The variable rate will probably fall to a range of about 3.2% to 3.5%, down dramatically from the current 6.48%. The fixed rate looks likely to hold at around 0.4%, I think, or just a bit higher.
I’ll still be a buyer up to the $10,000 purchase limit, probably in April but possibly in May. We’ll know more after the March inflation report is released on April 12.
I know a lot of investors will be bailing on I Bonds this year, but I like them as a long-term investment, pushing inflation-adjusted cash into the future with zero risk. Sometime in the future, I believe, interest rates will again be near zero and I Bonds will be out-performing every other safe investment.
Nominal Treasurys are losing appeal. Thinking of investing in nominal Treasury bills, notes or bonds? Focus on the T-bills with maturities of 6 months or less, where yields continue to be appealing. Here’s a comparison of Treasury estimates from March 8 to April 3:
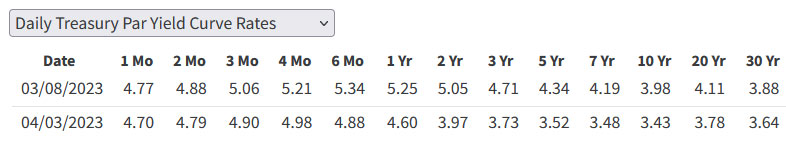
While short-term rates have declined slightly, the drop in medium-term Treasury rates has been much more dramatic, with the yield on a 2-year Treasury note down 108 basis points and the 5-year down 82 basis points. The 10-year note is down 55 basis points, surpassing the 39-basis-point decline in the 10-year TIPS real yield. I my opinion, this makes TIPS more appealing versus the nominal Treasury.
Bank CDs are gaining appeal. I posted an analysis Sunday morning noting that certificates of deposit offered by banks and credit unions are becoming more attractive as financial institutions scramble to build deposits. One- and two-year CDs are now yielding more than 5%. You can find a 5-year CD with a yield of 4.5%, which sets up an inflation breakeven rate of 3.4% versus a 5-year TIPS. That looks compelling.
Will inflation average more than 3.4% over the next 5 years? It’s possible, but it’s a close call. That makes TIPS and high-yielding bank CDs complimentary investments.
Cash is now A-OK. Getting 4%+ safely on your cash holdings is a wonderful thing, after years of earning around 0.01%. (It was strange at tax time to realize you didn’t have to report your lofty annual interest of 92 cents.)
Those ultra-low interest rates forced many investors to take risks, boosting bizarre investments like Dogecoin, NFTs and GameSpot. But I should mention that one very safe investment — the U.S. Series I Savings Bond — also surged in popularity as inflation began rising.
Now cash is earning a spot in your portfolio. For shorter-term cash needs, T-bills are the choice, or a high yielding Treasury money market fund like Vanguard’s VUSXX. In a recent article, investment manager William Bernstein made the case for combining TIPS for the long term and T-bills on the short term. He noted:
A TIPS is risky in the short term and riskless in the long run, which is precisely the opposite of, and complementary to, a T-bill, which is riskless in the short term but, because of reinvestment rate volatility, risky in the long run.
Final thoughts
TIPS remain appealing because of the inflation protection they provide as we are head into an uncertain future. For me, I Bonds will remain an automatic investment. I will continue to roll over 13- and 26-week Treasury bills as a core cash holding. And will keep hunting for attractive CD rates, either directly from banks or through brokerages.
In other words: I’m staying the course. What do you think? Post your thoughts in the comment section below.
* * *
Feel free to post comments or questions below. If it is your first-ever comment, it will have to wait for moderation. After that, your comments will automatically appear.Please stay on topic and avoid political tirades.
David Enna is a financial journalist, not a financial adviser. He is not selling or profiting from any investment discussed. I Bonds and TIPS are not “get rich” investments; they are best used for capital preservation and inflation protection. They can be purchased through the Treasury or other providers without fees, commissions or carrying charges. Please do your own research before investing.

I have a mix of T-bills that has historically been 4-26 weeks, but I recently added one that’s 52 weeks, managing to catch the March dip in rates perfectly 😦 . I-bonds and TIPS at 5- and 10-year maturities round out the picture.
For T-bills or TIPS vs. CDs, an additional factor in favor of T-bills and TIPS is that the interest is free from state taxes. Depending on the state, that can have a non-negligible impact. I get a de facto 6% boost, meaning my 5% T-bill rate turns into 5.3%.
I wonder if some of these CD rates (particularly brokered CDs) are higher than you would expect based on current Treasury yields, because banks are desperate to get some deposits that can’t disappear overnight, rather than hang out their dirty laundry for every one to see at the new Fed lending facilities
2-5 year CD rates are basically where they were when 2-5 year Treasury yields were a full 1-1.5% higher than they are now.
Banks are definitely scrambling to shore up deposits. The mega-banks continue to offer ridiculously low rates (0.03%) to their customers while at the same time offering much better rates through brokered CDs.
Do you think any tips rate 1% or over is a good deal? Seems like it looking at the last decade.
Yes, 1% real is good versus the last decade of ultra low rates.
Hi, I’m curious as to your thoughts about volatility of treasury bills and short term treasury money market funds with respect to the upcoming debt ceiling issue. Would there be turmoil in the treasury money market funds? If yes, how would it manifest itself? Loss in par value? Inability to pay (temporarily)?
Would it be better to consider cash reserves or government money market funds for short-term cash needs? The rates seem similar with less reliance on treasuries.
Thank you.
I think if we get to the brink of disaster (we will) you could see 4- and 8-week yields rise. I’m not worried about losing par value. Money market funds invest in these T-bills, too.
Learning question…I was curious from the standpoint of would treasuries of any type have their interest payments made if the government can’t service its debt due during a debt crisis like the fiscal limit not being raised?
No one knows the answer, but it is believed that the Treasury will prioritize interest and maturity payments for its issues. Other spending could be cut or delayed.
Hi All, I posted my comment this morning on the Bogleheads Board and both Bill Bernstein and Mel Lindauer weighed in. I gave attribution to David for this weekend’s column, too.
https://www.bogleheads.org/forum/viewtopic.php?t=401908
Or if the link doesn’t work, it is titled “I Bonds and Bill Bernstein’s Maxim.”
The link worked. Thank you for sharing and nice to see Lindauer comments.
Hi David, I’ve been building an I bond position since the early aughts for the very reason you note above: “pushing inflation-adjusted cash into the future with zero risk.”
I recall Bill Bernstein’s advice: “When you’ve won the game, stop playing…. So, retirement nest-egg-wise, what constitutes ‘winning’? Simple: You’ve won when you’ve acquired enough assets to provide your basic living expenses for the rest of your life.” (WSJ 01192015)
My goal is to keep moving as much as I can of my hard earned money into I bonds – if your investments safely keep up with inflation why not be an inflation protected saver instead of a stock & bond market gambler?
Best, Mike
“-if your investments safely keep up with inflation why not be an inflation protected saver instead of a stock & bond market gambler?”
I’m veering a bit off-topic here, but I feel a need to point out the difference between “investing in market” and “playing the market.” The latter is what I think people are referring to when they speak of a person being a stock & bond market gambler. To me that is one who is focused more on market prices and market psychology than on the strength of the companies behind those prices. Retired as my wife and I are, exclusive of our defined benefit pensions which are managed by others outside of our control, the majority of our retirement assets are invested is stocks and stock funds. They go up, they go down. But in the long run they’ve stayed ahead of our bonds, with the bonds smoothing out some of the bumps. We don’t gamble. We research the funds and the companies in them and we invest.
The idea is if you have enough cash accumulated to last a projected lifetime, and you do not have other concerns such as maximizing your estate for your heirs, then there is no need to risk that your stock funds will recover from the dips and you can focus on preserving the wealth through interest returns. Also remember that in retirement you would potentially be withdrawing from the stock funds during the dips and eroding the principal while hoping that the market recovers. Oprah has said she does not invest in stocks with her personal assets.
Hi Rob, Where you write:
“…there is no need to risk that your stock funds will recover from the dips and you can focus on preserving the wealth through interest returns.”
Are you saying to invest in dividend paying stocks funds and ignore their underlying value? Or simply to avoid stocks funds altogether?
Hi Mike, I am not recommending anything, but I am uncertain that the markets, Dow and S&P have reached bottom yet. However, I cashed out all my 401k’s and they are sitting 100% in Money Market right now despite the chatter of radio financial experts saying that it is foolish to do so since apparently their crystal balls say the markets have reached bottom.
Actually, my strategy with stocks right now is to try to identify high dividend blue chips. I have my eye on Dow Chemical (DOW). I don’t think Dow will go bankrupt, but I am uncertain that it has reached bottom, having been burnt with stocks over the last couple of years. While I am more focused on the dividend, I still don’t want to take heavy capital losses and the lost opportunity to have bought cheaper with a higher dividend yield. Also, while Dow pays a robust dividend, I wonder if this is sustainable in a recession, which I think is a continuing threat.
My claim to fame with stocks is buying Apple for thirty and selling for twenty in the Nineties – 😉
I’ve picked four tech giants, put a small percentage of my portfolio in them, and will never sell. My heirs can have whatever they become in the ensuing years.
I’m old enough to remember that the DOW first hit 1,000 in 1966, and was 800 in 1982
That includes a period when interest rates were as high as 18%
And prior to that, it took 30 years for the DOW to exceed its 1929 peak
If you look at a long term exponential chart of the averages, you’ll see we’ve been well above trend for a long time
Some Elliott wave technicians think we’re at the top (or may have topped in Jan 2022) of a bull cycle that started in 1932, or even going back to the formation of the country. Some think there’s one more leg higher
But it’s dangerous to extrapolate the extraordinary performance of the market since 1982. As I’ve pointed out, there have been periods when the market was down for periods exceeding my life expectancy.
https://www.macrotrends.net/1319/dow-jones-100-year-historical-chart
Or more recently, SPX at 1550 in early 2000, and SPX at 666 nine years later in March 2009, a drawdown of almost 60%
A retired person might not have the opportunity to recover from that
That chart is the greatest support in the world for the idea of short term investing and stock market timing. I am not any good at it, but that is exactly how the chart should be understood.
If by “short term” you mean 10-30 years, which is what the chart illustrates is how long drawdowns can last when you go above trend
That outcome doesn’t seem possible to people who haven’t lived through or invested through a multi-decade drawdown. I know (or knew) people who lived through the Depression who never invested in the stock market again
Their experience and reaction was extreme, as is the mindset of people who look at the bounceback from COVID and believe the market always comes back in a matter of months
Addendum – I quoted the nominal decline from 1966 to 1982 from memory
That chart actually provides the inflation adjusted Dow
Inflation adjusted, the drawdown from Jan 1966 to Jul 1982 was from 8984 to 2495 – a drawdown of 72%
Paul, my wife and I have 35% of our portfolio in low-cost total stock market funds. We try to keep it around that level by re-balancing. And that’s about it.
Cleveland Fed shows Month-over-Month CPI inflation rose to 0.5 on 4/4/23.
https://www.clevelandfed.org/indicators-and-data/inflation-nowcasting
Does this mean I-Bonds might see an 11th hour bump in the next variable rate?
I have been expecting a bump, mainly because non-seasonal inflation runs higher than seasonal from January to June, and then lower than seasonal from July to December. The Cleveland Fed’s nowcasting hasn’t been super accurate in recent months. But I am figuring the number will be in the 0.3% to 0.4% range. Who knows?
0.3% to 0.4%? You surely mean the fixed rate. I was asking about the variable rate.
Mr. Enna, the Cleveland Fed nowcasting model uses seasonally adjusted month-over-month inflation rates.
According to my math, MARCH non-seasonally adjusted CPI-U has averaged 0.49% over the past decade.
March 0.49% average increase of non-seasonally adjusted CPI-U:
2022=1.3
2021=0.7
2020=negative 0.2
2019=0.6
2018=0.2
2017=0.1
2016=0.4
2015=0.6
2014=0.6
2013=0.3
2012=0.8
TOTAL=5.4%
0.49% (5.4%/11 prior years)
I’ve written in the past that non-seasonally inflation tends to run higher than seasonal from January to June and lower from July to December.. https://tipswatch.com/2023/01/13/is-the-i-bonds-variable-rate-heading-to-zero-maybe-not/ … But I wouldn’t try to average 10 years of inflation rates. Most likely if seasonally-adjusted inflation comes in a 0.3% for March, non-seasonal will be a bit higher.
JS, I was referring to the March inflation rate, for the month, of about 0.3 to .04%. That would result in a variable rate of about 3.3% to 3.5%. Be ready for anything, though.
Thank you for the clarification!
Cleveland Fed reporting another month-over-month CPI rise from 0.50 to 0.56. Good news for I Bond investors?
https://www.clevelandfed.org/indicators-and-data/inflation-nowcasting
0.5 estimate is for the April CPI number, to be reported in May
The March CPI, to be reported next week, is estimated by the Cleveland Fed to be 0.3, with YOY dropping to 5.22 from 6.04
This would be seen I think as a big win for the Fed
If Cleveland is right, however, YOY jumps up to 5.31 for April (again, we’re talking about the number to be reported in May)
That would be the first time since last June that YOY CPI increased
That would be seen as a disaster, I think, suggesting sticky inflation may be in store for sometime
https://ycharts.com/indicators/us_consumer_price_index_yoy
I should mention, however, that so far we both have been talking about headline CPI, not core
Core CPI (which the Cleveland Fed DOES NOT PROJECT, read their page carefully) may be more of a problem. Cleveland Fed uses last month’s change in Core as their “projection” of this months Core
According to Forbes, March Core CPI is expected to be 0.45, replacing March 2022 Core CPI of 0.31 in a YOY calculation
https://www.forbes.com/sites/simonmoore/2023/04/05/what-to-expect-from-upcoming-cpi-inflation-figures/?sh=3d59c6145204
Thus it’s possible that CORE CPI on a YOY basis will increase when the figures are released this coming Wednesday, for the first time since Sep 2022
https://ycharts.com/indicators/us_core_consumer_price_index_yoy
That might be a shocking headline, and perhaps more meaningful wrt the Fed
I’ll simplify all the gobbledygook.
I bonds > individual TIPS > TIPS ETFs. None of them are very good, but ok in a diverse portfolio if you trust lending to the government to compensate you for the inflation that the government itself created in the first place.
Really that’s all it is.
I still like individual TIPS held to maturity more than I Bonds, but the spread is getting slimmer.
I can’t remember why I Bonds were created, or if I ever read why, but when they were during the Clinton Administration, inflation was very low. So my thinking is that the government was saying that we are so confident that inflation will be permanently low, that we are going to offer this new instrument that will be tied to inflation, that no other entity offers, for 30 years.
David, perhaps on your day off you can write an article on the genesis of the I bond, if interested.
Thank you for the site! I have retired and taken most of our money out of the stock market, focusing on “wealth preservation.” With skills learned here, during the month of March i built a TIPS ladder with purchases on the secondary market, maturing 2024 – 2032 at real YTMs 1.43 to 2.24 (as our hedge against inflation), and CDs maturing 2024 – 2028 at nominal 5.0 – 5.5% (as our hedge against deflation). Those values are now gone, so i’m glad i bought at/near the March “highs.” Those all carry reinvestment risk, of course, but i’m working on stashing the remainder of our pile in bond funds to balance reinvestment risk, then whatever we don’t need to spend at maturity, i’ll roll over into iBonds and/or TIPS at future auctions. Here’s to sleeping well at night no matter what the stock market does!
Glad to see this is working!
Thank you for always providing such high quality commentary regarding an investment space that is of great interest to me (an old retired guy!).
Are the auction bidders weak negotiators- Why would so many bids support an interest rate that is so much lower than the effective federal funds rate- Even if we expect interest rates to be lower tomorrow we should all negotiate for the highest rates possible everyday. Why are the bids so low?
It is baffling, but the market tries to predict the future, not the past. The market sees the Fed halting interest rate increases soon and then *possibly* cutting rates if the economy swoons.
Institutions may be trying to get out of treasuries and they may not have the money to purchase today’s treasury offerings. For the first time in a long time it may be necessary to boost the fixed rate on EE and or the I bond to get the people to stowe away their earnings rather than the institutions which may be temporarily side-lined. I am looking for additional thoughts either contrary or supporting.
I don’t think the Treasury is having any problem issuing and selling Treasurys and I don’t think there will be any effect on the rates it sets on EE Bonds and I Bonds. Yields have declined since the bank failures, indicating that demand is still strong.
Rick Santelli on CNBC described some of the recent auctions as “sloppy” with longer tails than recently
D I am weighing either more ibonds, or a 5 or 7 year treasury. R
Today it seems like buying the ibonds in April is the winner, but maybe buying a short term treasuries and continuing to weigh whether or not to purchase an ibond prior to November is the better decision. E I appreciate hearing the thoughts of others. J Thank you in advance.