
Soon after I woke up Friday morning, I heard on the radio that the U.S. economy had created 195,000 jobs in June and many more in April and May than was previously thought. My immediate thought was: “Ooops, that won’t be good for TIPS.”
Here is the reason, summed up nicely in the Associated Press jobs report:
The job growth suggests a stronger economy and makes it more likely the Federal Reserve will slow its bond purchases as early as September.
And here is what a 5-day, holiday-week chart looked like for the TIP ETF, which holds a wide range of Treasury Inflation-Protected Securities, and SPY, the ETF that tracks the Standard & Poors 500:
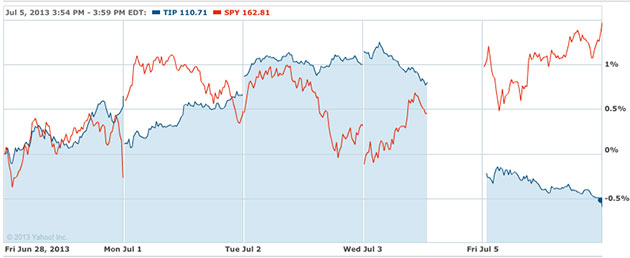
The stock market greeted Friday’s positive jobs report with a buying surge, but the overall bond market – and especially Treasuries – suffered.
In more-normal times, TIPS investors are OK with positive economic news, because it brings the possibility of higher inflation, which is the reason investors buy TIPS. And in the reverse, negative economic news brings the fear of deflation, which is not good for TIPS.
At the moment, we are in non-normal times, and the situation is reversed. TIPS will be helped by negative economic news and hurt by positive economic news. This is because of the overhanging fear of Federal Reserve ‘tapering’ (or outright halting) of bond purchases. Any positive economic news is going to be negative for TIPS.
TIPS in mid-2013 face the worst-possible conditions: Rising interest rates combined with very low inflation. As long as overall interest rates are rising, and annual U.S. inflation remains below 2.0%, TIPS will have little appeal to investors.
The result will be higher yields and lower prices for TIPS on the secondary market.
Positive economic news will mean higher interest rates. This is almost guaranteed by the Fed, and the market has started pricing this in.
Inflation is the X Factor. TIPS will suffer until we see some evidence of igniting inflation. Until then, TIPS will be getting more and more attractive as a buy-and-hold-to-maturity investment.
In other words: Buying opportunity.


Dr Matt....Sell and buy options