
By David Enna, Tipswatch.com
TreasuryDirect gets a lot of bad press, mostly deserved, for presenting a clunky website with a bureaucratic mess of rules and usually lousy customer service.
I’ve been using TreasuryDirect services for at least 32 years, even before the website launched in 2002. Overall, the system has worked for me, but obviously I am a very experienced user.

The Wall Street Journal last week presented an “exclusive” on one of the major faults of TreasuryDirect: You cannot sell traditional Treasury purchases on the site. The securities have to be transferred to a brokerage (a tedious process), and then sold. And TreasuryDirect, shockingly, says the process can take up to 12 months.
That leads to my one key rule for using TreasuryDirect: Never purchase anything that you may have the slightest need to sell before maturity. There are two exceptions to that rule:
- U.S. Savings Bonds, which after a year can be redeemed at TreasuryDirect and then have money sent to your bank or brokerage within a couple days. TreasuryDirect is the only place you can buy electronic versions of Series I and EE Savings Bonds, and is the only place you can redeem them. This process works well.
- Short-term T-bills, which will mature in 4 to 52 weeks. Buyers can wait out the maturity period. And smart investors can stagger their purchases to always have access to some money within a month. I am a fan of using TreasuryDirect to purchase T-bills, because the rollover process is flawless. A T-bill matures and a new one is purchased on the same day. At some brokerages, the rollover process can lead to a one-week delay.
It makes no sense to buy traditional Treasurys (TIPS, notes or bonds) at TreasuryDirect if you think you would need to sell them before maturity. The Wall Street Journal article says this about transfers:
TreasuryDirect tries to complete most of them within six weeks, but can take 12 months, depending on capacity. A notice on the TreasuryDirect website says some customer-service requests “may require 12 months or more to process.” The notice had said the longest delays were about six months until the end of July.
A spokesperson for the Treasury’s Bureau of the Fiscal Service said the program has “significant processing delays due to resource and technology constraints.” The Treasury Department is looking to modernize its program “to ensure better, more modern experiences.”
In a followup article on CNBC, the Treasury tried to spin a more positive outlook:
When asked about wait times, the spokesperson said that it “depends more on complexity than capacity” and that processing times are “well under one year right now and declining daily.”
“The website’s processing timeframes are meant to give the longest potential times for the complex, difficult cases — these processing times are often much shorter and continue to decrease as we dedicate more resources,” they said.
OK. But imagine if your brokerage told you it might need a year to complete your sales order. That brokerage would be out of business in weeks. Transferring securities is not a core goal of TreasuryDirect, clearly.
The WSJ article includes an anecdote about an investor who purchased a 20-year Treasury bond in January to lock in 4.75% returns. And then:
(The investor) was prepared to hold on to the bond through a mandatory 45-day waiting period before he could transfer it to his brokerage account.
Over the summer, he called TreasuryDirect’s customer-service line to check on the status of his transfer and was told processing could take up to a year. “I never in a million years would have put away $10,000 that I couldn’t get for a year if I needed it,” he said.
What is interesting in this anecdote is that the investor purchased the 20-year bond with the intention of moving it quickly to his brokerage account. When I read that, I screamed out loud at the breakfast table, “You have a brokerage account! Why didn’t you buy the Treasury bond in that brokerage account?”
But the story continues:
Even before learning about the delay, (the investor) had to print a transfer request form and get a medallion signature, a notary-style stamp to verify security transfers, before mailing it to the Treasury Department. The delay prompted him to file several complaints with the site and write a letter to his congressional representative hoping to expedite the process.
Again, all of this could have been avoided by simply purchasing any longer-term Treasury investment in a brokerage account, not TreasuryDirect. But the Wall Street Journal reports: “About two-thirds of the purchases on TreasuryDirect so far this year have been marketable securities instead of savings bonds.” I suspect a lot of those were T-bills, which are fine.
Treasurys of all types can be purchased in a brokerage account, usually with zero commission. Want to participate in a Treasury auction? You can do that at a brokerage, too, almost always with zero commission. You will get exactly the same yield and price as any auction buyer on TreasuryDirect.
Treasurys are liquid investments. Any Treasury you hold at a brokerage usually can be sold within days, but will incur a small commission and possible bid/ask spread. The sole advantage of TreasuryDirect for Treasury auctions is its minimum purchase of $100, much lower than the typical brokerage minimum of $1,000.
And one final point: You cannot open a tax-deferred account at TreasuryDirect. So if you want to purchase Treasury Inflation-Protected Securities in a retirement account, you must do that at a brokerage. This is the preferred way to purchase TIPS.
My experiences
I started using TreasuryDirect in its “legacy” form in the 1990s and transferred all securities to the current TreasuryDirect in 2002. Over the years, I have purchased many Treasury Inflation-Protected Securities there and all but six have matured. Those six will mature in years 2025 to 2029, plus 2041.
Back in 2018, our hourly-fee financial adviser (the noted author Allan Roth) suggested that we move all our TIPS holdings out of TreasuryDirect to a brokerage and then sell them, because TIPS don’t belong in a taxable account. That is the correct advice, but I didn’t do it. I wasn’t going to sell my TIPS holdings before maturity.
When I purchased these TIPS, I was absolutely certain I would hold them to maturity. So TreasuryDirect’s clunky transfer policies were not a concern. And I have never felt TIPS absolutely should be limited to a tax-deferred account. When these TreasuryDirect TIPS mature, I get the proceeds with nearly zero taxes owed (it’s all been prepaid).
One strange “advantage” of holding TIPS at TreasuryDirect is that the website will never show you — or calculate — market value. The only value it presents is somewhat recent par value x inflation index, which is what you will receive at maturity. Because TIPS can’t be traded at TreasuryDirect, the value it shows does not fluctuate with market jumps. I find this calming. Others would disagree.
But since 2018, I have never purchased another TIPS at TreasuryDirect. The reason: I have moved all these transactions to a traditional IRA at Vanguard, where money can be redistributed without any tax concerns.
The key takeaway from all this is that TreasuryDirect is exclusively great for one thing: purchasing, holding and redeeming savings bonds. It is also useful for purchasing and reinvesting T-bills. Beyond that, I’d recommend using a brokerage account for Treasury purchases.
* * *
Follow Tipswatch on X (Twitter) for updates on daily Treasury auctions and real yield trends (when I am not traveling).
Feel free to post comments or questions below. If it is your first-ever comment, it will have to wait for moderation. After that, your comments will automatically appear. Please stay on topic and avoid political tirades. NOTE: Comment threads can only be three responses deep. If you see that you cannot respond, create a new comment and reference the topic.
David Enna is a financial journalist, not a financial adviser. He is not selling or profiting from any investment discussed. I Bonds and TIPS are not “get rich” investments; they are best used for capital preservation and inflation protection. They can be purchased through the Treasury or other providers without fees, commissions or carrying charges. Please do your own research before investing.

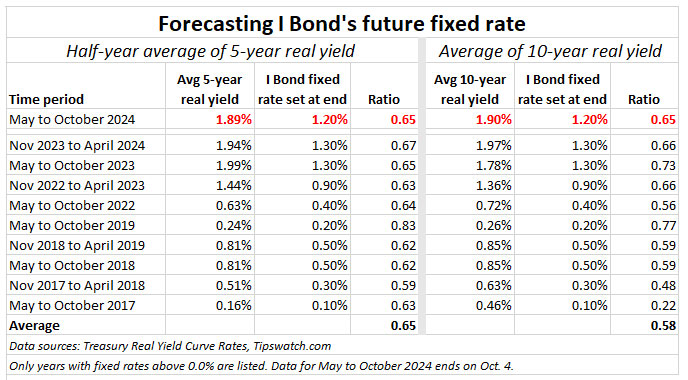


David's fixed rate predictions have been stellar. I hope "the variable rate would soar to 3.22%." That would give a…