
The answer is: Yes, generally it does.
By David Enna, Tipswatch.com
Jumping right into it, I’m going to say, yes, the formula used to determine the Social Security cost-of-living adjustment shortchanges seniors.
But let’s be clear: I’m not talking about whether the official Consumer Price Index accurately reflects inflation. And I’m not talking about the fact that the COLA gets eaten away each year by Medicare premium increases. Both of those are legitimate concerns.
Here’s what I am talking about: The formula used to determine the Social Security COLA lags behind official inflation numbers.
Here are key factors in the COLA formula:
- Inflation Index Weirdness. The COLA is based on the little-followed Consumer Price Index for Urban Wage Earners and Clerical Workers (CPI-W) instead of the ‘headline’ inflation number you read about each month — the Consumer Price Index for All Urban Consumers (CPI-U).
- Formula Weirdness One. The Social Security Administration doesn’t look at a full year of CPI-W to determine the COLA. Instead it uses the average index for months of the third quarter – July, August and September. By averaging three months of data, the formula lessens the effect of a one- or two-month spike in inflation, which happened this year.
- Formula Weirdness Two. In years where there is deflation instead of inflation, the COLA is set to 0.0% and the formula skips that year in determining the next year’s COLA. We have had two deflationary years in the last 10 years (2009 and 2015), but this ‘skipping’ mechanism has resulted in three years of 0.0% COLAs (based on data in 2009, 2010 and 2015).
To get us started, here’s the official COLA definition from the Social Security Administration:
A COLA effective for December of the current year is equal to the percentage increase (if any) in the average CPI-W for the third quarter of the current year over the average for the third quarter of the last year in which a COLA became effective. If there is an increase, it must be rounded to the nearest tenth of one percent. If there is no increase, or if the rounded increase is zero, there is no COLA.
And here are the numbers I’ll be using in this article. Sorry, there are a lot of numbers to discuss!
 CPI-U versus CPI-W

I’ve never found an explanation of why CPI-W is the basis of the Social Security COLA calculation. It is designed to trace how retail prices affect workers who are paid hourly and those that do clerical work. According to the site DifferenceBetween.net:
The CPI-W gives more importance on everyday needs such as food and transportation expenses, clothes, and other goods and services. Housing, medical care, and recreation are given less importance in the CPI-W.
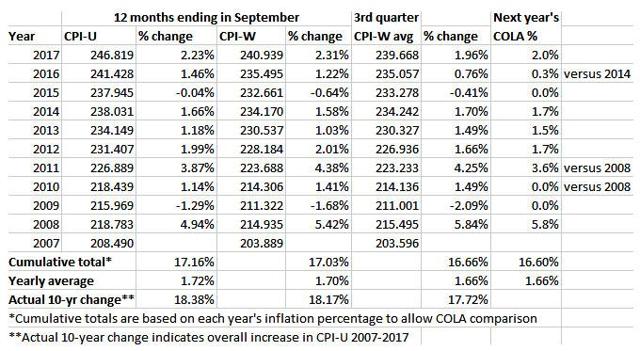
I think we can all agree that medical care expenses are very important for senior citizens – probably one of the biggest challenges in retirement. And medical care expenses tend to rise faster than overall inflation. In fact, CPI-W lagged slightly behind overall inflation from 2007 to 2017. CPI-U increased a total of 18.38% and CPI-W was up 18.17%.
Effect of averaging 3 months of data
By averaging CPI-W data for three months, the Social Security formula lessens the effect of one-month swings in inflation. In fact, this happened in 2017 in the aftermath of Texas storms and a resulting spike in gas prices. September’s year-over-year increase in CPI-W was 2.31%, but the COLA’s 3rd-quarter calculation came in at 1.96%, resulting in a COLA increase of 2.0%. To summarize:
- CPI-U was up 2.23% year over year in September 2017.
- CPI-W was up 2.31% year over year.
- The Social Security COLA was set at 2.0%.
Over the last 10 years, the averaging mechanism has resulted in some higher numbers, too, in individual years. But overall the increase in the ‘average index’ was 17.72%, less than the 18.38% increase in CPI-U and 18.17% increase in CPI-W. That’s a lag of 66 basis points compared with overall inflation.
Also, take a look at the cumulative totals for the yearly percentage increases, which combine negative and positive years. Social Security’s averaging calculation results in the COLA lagging overall inflation by about 6 basis points a year — 1.66% versus 1.72% for CPI-U. Over 10 years, the lag was 50 basis points.
Effect of skipping years after a 0.0% COLA
One of the positives of the Social Security COLA formula is that the COLA can’t go negative – the increase in payments can’t be less than 0.0%. So in years of deflation, the COLA is set to 0.0% and the next year’s calculation reverts to the last year with an increase in the COLA.
Look at how that affected recipients in 2009 and 2010. In 2009, the CPI-W average was down 2.09% and the COLA was set to 0.0%. In the next year, the CPI-W average rose 1.49%, but the COLA was again set to 0.0%. Why? Because the formula skipped 2009 and used the higher 2008 number.
This all seems fair, because Social Security payments don’t go down in times of deflation. In the last 10 years, the net effect of the ‘skipping years’ formula has been minimal — a cumulative increase of 16.60% for the COLA versus 16.66% for the cumulative increases in CPI-W.
Comparing I Bonds with the Social Security COLA
U.S. Series I Savings Bonds have a variable return based on CPI-U, so even with a fixed rate of 0.0% they should in theory track fairly closely with the Social Security COLA increase. But in fact, I Bonds greatly out-perform the COLA, for these reasons:
- The return is based on CPI-U, not the slightly lower CPI-W.
- Like the COLA, the return can never be negative, even in years of deflation.
- But after deflation, the calculation of the variable return does not skip a year. It is based on the lower deflationary number, and therefore gets a larger ‘bounce back’ increase.
Here are the numbers over the last 10 years:
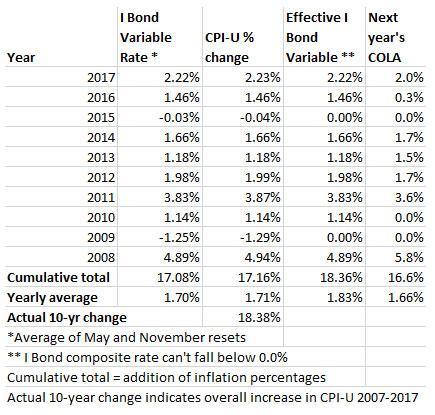
The first thing to notice is how closely the yearly changes in the I Bond’s variable rate – which is reset each May and November – track changes in CPI-U. Over 10 years of cumulative changes, the difference was only 8 basis points: 17.08 versus 17.16%. Conclusion: The I Bond variable rate accurately tracks official inflation, much better than the Social Security COLA.
Plus, there’s a bonus to owning I Bonds: Deflation protection. Look at the effect of the 0.0% floor in the variable rate. The lack of deflation raises the overall return to 18.36% over the last 10 years, almost exactly the 18.38% change in the CPI-U index from 2007 to 2017. And that 1.83% average annual return is well above the 1.66% increase in the Social Security COLA.
The terms for I Bonds are kind to buyers of these inflation-protected investments. The terms of the Social Security COLA aren’t so kind for retirees:
- The COLA lags official U.S. inflation, measured by CPI-U.
- The COLA lags inflation measured by its index, CPI-W.
- The COLA lags the inflation-adjusted returns provided by Series I Savings Bonds.

Pingback: Projection: Social Security COLA for 2025 should be around 2.7% | Treasury Inflation-Protected Securities