By the time you read this, I will be arriving in Thessaloniki, Greece, to begin a 3-week jaunt across northern Greece, Albania, and North Macedonia. This is the land of Zeus and Alexander the Great, but also probably the land of lousy internet, at times. We’ll be in some remote places.
So over the next couple weeks, I will be slow to provide updates, approve comments, answer questions, and track trends. I will try when I have time and internet. These weeks shouldn’t be particularly newsy but you never know.
What’s coming up?
Wednesday, Sept. 20: At about 2:05 p.m. ET the Federal Reserve will announce the interest-rate decision of its Open Market Committee. I am expecting interest rates to hold steady and then we will hear Jay Powell say some fairly hawkish things in his press conference. “Future rate increases are still possible.”
It’s possible the Federal Reserve has hit its peak short-term interest rate in the range of 5.25% to 5.50%. The short-term T-bill market has been stable for several weeks, which seems to indicate investors think rates will hold at these levels, possibly for many months.
I won’t be writing about this announcement, but you’ll have hundreds of other sources and opinions to read shortly after 2 p.m.
Thursday, Sept. 21: At 1 p.m. Thursday ET (or 8 p.m. in Greece) the Treasury will announce the result of its 10-year TIPS reopening auction. I have posted a preview of the auction, so read that to learn more. Sometime after the auction, I hope to post an abbreviated article on the results.
FYI, CUSIP 91282CHP9 was trading on the secondary market Monday morning with a real yield of 1.98%, so it was still looking attractive, either as a purchase at auction or on the secondary market this week.
Tuesday, Sept. 26: The Treasury will auction a 2-year Treasury note. The key here will be if the high yield ends up above 5%, which is within 50 basis points of much shorter-term T-bills. This would indicate the market believes interest rates will hold at high levels well into 2024.
There are some good nominal yields out there. In Charlotte, a local credit union is offering an 11-month CD with an annual yield of 6.25%, minimum deposit of $5,000.
Huge news coming in October
As Arnold Schwarzenegger famously said, “I’ll be back.”
I’ll be home in time for the September inflation report, which will be issued at 8:30 a.m. Oct. 12. This is the most important inflation report of the year, because it will:
Set a path for future Federal Reserve interest rate decisions.
* * *
Feel free to post comments or questions below. If it is your first-ever comment, it will have to wait for moderation. After that, your comments will automatically appear. Please stay on topic and avoid political tirades.
David Enna is a financial journalist, not a financial adviser. He is not selling or profiting from any investment discussed. I Bonds and TIPS are not “get rich” investments; they are best used for capital preservation and inflation protection. They can be purchased through the Treasury or other providers without fees, commissions or carrying charges. Please do your own research before investing.
This year, for the first time, I’ve soured on buying Treasury Inflation-Protected Securities at auction. Why? Because real yields have often come in a bit below “predicted” market value. That’s been especially true of the 10-year maturity:
Jan. 19, 2023: A new 10-year TIPS – CUSIP 91282CGK1 — auctioned with a real yield to maturity of 1.22%, below the when-issued prediction of 1.26%. The coupon rate was set at 1.125%.
March 29, 2023: That same TIPS reopened with a real yield of 1.182%. This auction was a winner, because premarket trading had it at 1.15%.
May 18, 2023: The same TIPS reopened at 1.395%, below the premarket trading of 1.41%.
July 20, 2023: A new TIPS — CUSIP 91282CHP9 — got a real yield of 1.495%, well below the when-issued prediction of 1.546%. The coupon rate was set at 1.375%.
For me, that last auction on July 20 was especially disappointing. (I was hoping for a coupon rate of 1.50% and just missed.) Now CUSIP 91282CHP9 will get its first reopening auction on Thursday. The results are likely to be much more attractive.
At Friday’s close, this TIPS was trading on the secondary market with a real yield to maturity of 1.98% — an increase of nearly 50 basis points in two months. And it is carrying a discounted price of 94.62. If that real yield holds, this auction will result in the highest 10-year auctioned real yield in more than 14 years.
But I won’t be a buyer, because I have filled the 2033 maturity on my TIPS ladder (with real yields of 1.22%, 1.40%, 1.495% and 1.964%). I’m done with 2033. My next purchase will be the 2034 TIPS to be auctioned Jan. 18.
If you are still working on 2033, this TIPS deserves a long look, either at auction or on the secondary market. You can check the current yield and price for this TIPS on the Bloomberg’s Current Yields page. Any real yield above 2.0% deserves consideration.
Definition: A TIPS is an investment that pays a coupon rate well below that of other Treasury investments of the same term. But with a TIPS, the principal balance adjusts each month (usually up, but sometimes down) to match the current U.S. inflation rate. So, the “real yield to maturity” of a TIPS indicates how much an investor will earn above inflation each year until maturity.
Here is the trend in the 10-year real yield over the last 5+ years, a period that includes one dramatic period of Federal Reserve easing (March 2020 to March 2022), one mild period of Fed tightening (2018) and one aggressive period of tightening (April 2022 to today):
Click on image for larger version.
Pricing
CUSIP 91282CHP9 will mature July 15, 2033. It has a coupon rate of 1.375%, well below the current market real yield of 1.98%, so it is selling at a substantial discount with a price of 94.62. This TIPS will have an inflation index of 1.00640 on the settlement date of Sept. 29.
What does this all mean for the price investors will pay? Let’s take a look at a potential $10,000 investment.
Par value = $10,000
Adjusted principal = $10,064 (based on the inflation index)
Cost of investment = $9,523 (based on price of 0.9462)
Accrued interest = About $28.40 (will be returned at first coupon payment)
Total cost = $9,281
This is a rough estimate, of course, and is based on Friday’s closing value. Things can change before the auction closes at 1 p.m. EDT Thursday. You will find similar pricing on the secondary market, adjusted for a slight bid-ask spread and a slightly lower inflation index.
Inflation breakeven rate
With a nominal 10-year Treasury note currently yielding 4.33%, this TIPS has an inflation breakeven rate of 2.35%, close to the originating auction’s 2.38%. By historic standards, this is a high breakeven rate, but seems reasonable as the Federal Reserve struggles to move inflation to near 2.0%. For the last 10 years ending in August, U.S. inflation has averaged 2.8%.
Here is the trend in the 10-year inflation breakeven rate over the last 5+ years:
Click on image for larger version.
Note that inflation expectations have been gradually declining since last summer, when U.S. inflation peaked at 9.1%. The current rate is 3.7%, still well above the 10-year expectations.
Final thoughts
This is a strong offering, in my opinion. Over the last several weeks I have been pushing hard to fill out my TIPS ladder, which extends to 2043. My primary focus has been on getting real yields around 2.0% for the 2040 to 2043 period. I’d definitely be a re-buyer of CUSIP 91282CHP9 if my 2033 rung wasn’t full.
Can real yields continue higher? Definitely? Maybe? We don’t know. Getting real yields in the 2.0% range for extended maturities is attractive, so it’s a good time to act. It is a sensible purchase and shouldn’t be regretted.
Ponder this: As recently as March 2022, a 10-year nominal Treasury was yielding 1.74%. Now you can get 1.9% to 2.0% aboveinflation. The trend is good for TIPS investors.
What about secondary market versus auction? My advice is to watch the secondary market for yields you find attractive. That way you can know exactly what you are buying. The auction, however, is a good option for buyers of smaller lots because all investors get the high yield, without any spread.
If you are pondering an investment at Thursday’s auction, keep an eye on Bloomberg’s U.S. Yields page, which updates in real time. It is accurate, but any auction result can bring surprises. The auction closes at 1 pm EDT. Non-competitive bids at TreasuryDirect must be placed by noon Thursday. If you are putting an order in through a brokerage, make sure to place your order Wednesday or very early Thursday, because brokers cut off auction orders before the noon deadline.
By Thursday, I will be traveling in northern Greece so I can’t say for sure when I will be able to post the results.
Feel free to post comments or questions below. If it is your first-ever comment, it will have to wait for moderation. After that, your comments will automatically appear. Please stay on topic and avoid political tirades.
David Enna is a financial journalist, not a financial adviser. He is not selling or profiting from any investment discussed. I Bonds and TIPS are not “get rich” investments; they are best used for capital preservation and inflation protection. They can be purchased through the Treasury or other providers without fees, commissions or carrying charges. Please do your own research before investing.
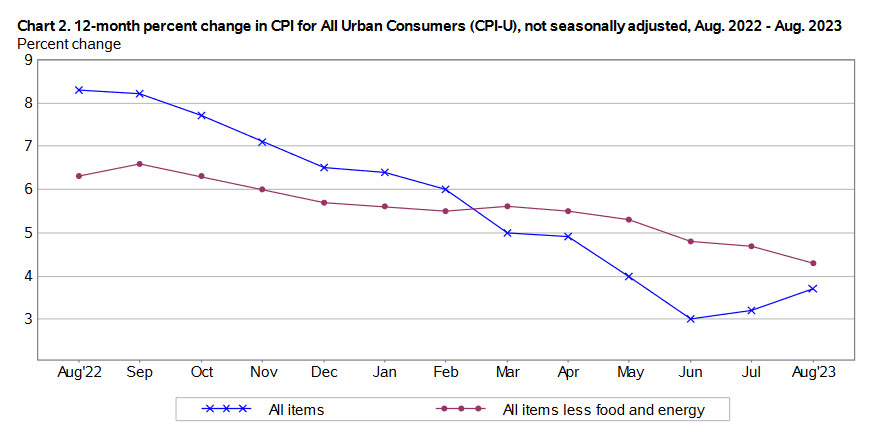
As expected, rising gasoline prices pushed U.S. inflation higher in August, rising a seasonally-adjusted 0.6% for the month and increasing 3.7% year-over-year, the Bureau of Labor Statistics reported today.
Core inflation, which removes food and energy, rose 0.3% for the month (higher than the expected 0.2%) but annual core came in at 4.3%, lower than the expected 4.4%. That most likely means core inflation was close to expectations, before rounding.
Nothing too shocking here, but the bump higher in annual all-items inflation from 3.2% in July to 3.7% in August is certainly an unwanted trend. Gas prices are felt immediately by the consumer, something the Fed and Biden administration can’t ignore.
The BLS noted that the rise in gasoline prices (up 10.6% for the month but still down 3.3% year over year) accounted for more than half the all-items increase in inflation. Shelter costs were the largest factor in core inflation, increasing 0.3% for the month and 7.3% for the year. Shelter costs have increased 40 consecutive months, the BLS said. Other items from the report:
Food at home prices rose a moderate 0.2% and are now up 3.0% year over year.
The index for dairy decreased 0.4%.
The energy index as a whole was up 5.6% for the month.
Apparel costs rose 0.2%.
The index for hospital services rose 0.7%.
Prescription drug costs rose 0.4%.
Costs of motor vehicle insurance rose 2.0%, the biggest one month jump since 1976.
Airline fares declined 8.1% but are still up 4.9% year over year.
August’s price increases came a year after inflation slowed dramatically in 2022, primarily triggered by a deep fall in gasoline prices. Now that trend is reversing. Here is the 12-month trend for all-items and core inflation, showing that core inflation continues to gradually fall while the trend has turned upward for all-items inflation:
What this means for TIPS and I Bonds
Investors in Treasury Inflation-Protected Securities and U.S. Series I Savings Bonds are also interested in non-seasonally adjusted inflation, which is used to adjust principal balances for TIPS and set future interest rates for I Bonds. For August, the BLS set the inflation index at 307.026, an increase of 0.44% over the July number.
For TIPS. The August inflation index means that principal balances for TIPS will increase 0.44% in October, after rising 0.19% in September. Here are the new October Inflation Indexes for all TIPS.
For I Bonds. The August inflation report is the 5th of a 6-month string that will set the I Bond’s new inflation-adjusted variable rate, which will be reset Nov. 1 for all I Bonds (the starting date depends on the original month of purchase). Inflation from April to August has increased 1.72%, which at this point would translate to a variable rate of 3.44%. But one month remains.
If non-seasonal inflation increases 0.2% in September, you’d get a variable rate of 3.84%, higher than the current 3.38%. Nothing is certain, of course.
The Social Security Administration uses a different inflation index — CPI-W — to determine the next year’s cost-of-living-adjustment. And it looks only at the average of three months of data, from July to September. For August, the BLS set the CPI-W index at 301.551, an increase of 3.4% over the last year.
For the COLA, the only 2022 number that matters is the three-month average from July to September 2022, which was 291.901. The average of the July and August CPI-W indexes was 3.0% higher. One month of data remain. I have been projecting an increase in the range of 3.0% to 3.2%, which could end up a bit too low.
The Federal Reserve has consistently signaled that it plans to hold short-term interest rates steady at its Sept. 19-20 meeting of the Federal Open Market Committee. While this August inflation report could deliver a psychological jolt to the U.S. consumer, the Fed will probably view it as “expected.”
However, core inflation of 4.3% is unacceptably high, so the Fed must continue its commitment to keeping rates at high levels, probably well into 2024. From today’s Bloomberg report:
The report complicates the picture for Fed policymakers, who meet later this month to set rate policy. While they’re likely to look through a temporary bump in energy prices, the shelter component is still running hot and gains across other categories could give them pause. The broader economic picture could also support another hike: The labor market, while showing cracks on the margin, remains tight.
Fed officials signaled last week they were preparing to hold interest rates steady at their meeting next week, and Wednesday’s inflation report isn’t likely to change that outcome. Whether it is enough to lead officials to raise interest rates again in November or December largely depends on whether inflation firms up in the coming months.
If gas prices continue to rise and eventually spread an inflationary effect to food and transportation costs, the American consumer will feel the pinch. And demands for higher wages would likely follow. That is something the Fed won’t be able to ignore.
* * *
Feel free to post comments or questions below. If it is your first-ever comment, it will have to wait for moderation. After that, your comments will automatically appear. Please stay on topic and avoid political tirades.
David Enna is a financial journalist, not a financial adviser. He is not selling or profiting from any investment discussed. I Bonds and TIPS are not “get rich” investments; they are best used for capital preservation and inflation protection. They can be purchased through the Treasury or other providers without fees, commissions or carrying charges. Please do your own research before investing.
I often caution readers about “non-seasonally adjusted inflation” and how it can create confusion and even distress as it sometimes skews away from headline inflation, the number you see reported each month.
Non-seasonally adjusted inflation is important for investors in Treasury Inflation-Protected Securities (where it is used to adjust principal balances each month) and U.S. Series I Savings Bonds (where it is used to set future variable interest rates).
Each month, the Bureau of Labor Statistics includes a paragraph deep down in its CPI report (this one is for July inflation):
Not seasonally adjusted CPI measures
The Consumer Price Index for All Urban Consumers (CPI-U) increased 3.2 percent over the last 12 months to an index level of 305.691 (1982-84=100). For the month, the index increased 0.2 percent prior to seasonal adjustment.
Once the inflation report is issued, I plug that number into the mega-chart on my Inflation and I Bonds page:
This chart shows you two things: 1) non-seasonally adjusted inflation ran at 0.19% in July (not the rounded 0.2% reported by the BLS) and that means principal balances for all TIPS will increase 0.19% in September. And 2) Four months into the I Bond’s rate-setting period, inflation has run at 1.28%, with two months remaining. The I Bond’s new variable rate — to be reset November 1 — appears to be heading toward a range of 3.2% to 3.4%.
What is this NSA inflation?
A new podcast from Michael Ashton, known around the financial world as the “Inflation Guy,” takes a crack at explaining non-seasonally adjusted inflation (NSA) in plain English. Although this is an esoteric, inside-baseball topic — and Ashton actually uses baseball as an analogy — it’s important for investors in TIPS and I Bonds to understand the basics of NSA. Take a listen:
In his intro, Ashton notes that the inflation derivatives market is suggesting that U.S. inflation will decline from August to December 2023. He notes:
Does this mean that deflation is upon us? No, and the reason why is something called ‘seasonal adjustment.’ It turns out that seasonal adjustment is critically important for inflation markets, and the market’s pricing is not nearly as outlandish as it looks.
Ashton clarifies something that I have noticed and written about over the years: that NSA tends to run higher than seasonally-adjusted ‘headline’ inflation from January to June, and then lower from July to December. At the end of 12 months, both NSA and seasonally-adjusted inflation will match. So if you run higher in the first half of the year, you’ll run lower in the second half.
He notes that the average investor has no interest in NSA versus official inflation, but investors in TIPS and I Bonds do:
Inflation people definitely care, because what gets traded in the market, what TIPS are based on, is non-seasonally adjusted inflation, whereas the number that gets reported, the headline number, is seasonally adjusted. ….
We know that prices have a strong tendency to fall in December, so we can adjust that number and then when see the official CPI report the December number is no more likely to be negative than any other CPI number.
The reality is that prices did decline in that particular December, so bonds tied to inflation ought to reflect the reality, not the seasonally adjusted reality.
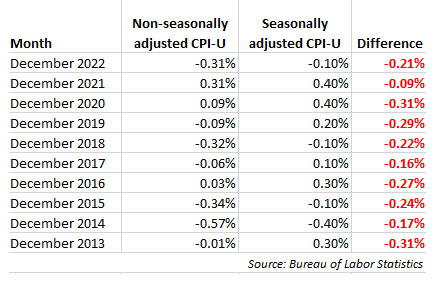
This isn’t just a “theoretical” premise — in fact, non-seasonally adjusted inflation consistently runs lower in December than the official seasonally adjusted number.
So, what does this mean for investors of inflation-protected products? The key thing is to recognize that your inflation expectations could take a temporary dive toward the end of the year.
For TIPS investors, the December number sets inflation index for the month of February. As Ashton points out, that means that a TIPS maturing in January (with inflation accruals set by inflation through November) could logically have a lower real yield to maturity than a TIPS maturing in April (with inflation accruals including the month of December). He says:
If you look at a whole list of TIPS, the whole TIPS yield curve, you’ll notice that TIPS that mature in April very often have slightly higher yields than similar maturity bonds that mature in January or July. … You’ll get these little bumps every April.
Given a choice between those two bonds, I’d always rather have the January maturity that doesn’t have to experience that print that I am pretty sure is going to be negative. So investors have to be compensated to hold the April maturity.
This doesn’t always hold up in reality, because TIPS have a lot of factors affecting real yield to maturity. A TIPS with a very high inflation accrual and high coupon rate will generally draw a slightly higher real yield than one with a low inflation accrual and discounted price. Plus, today’s TIPS market is skewed toward higher yields on shorter maturities.
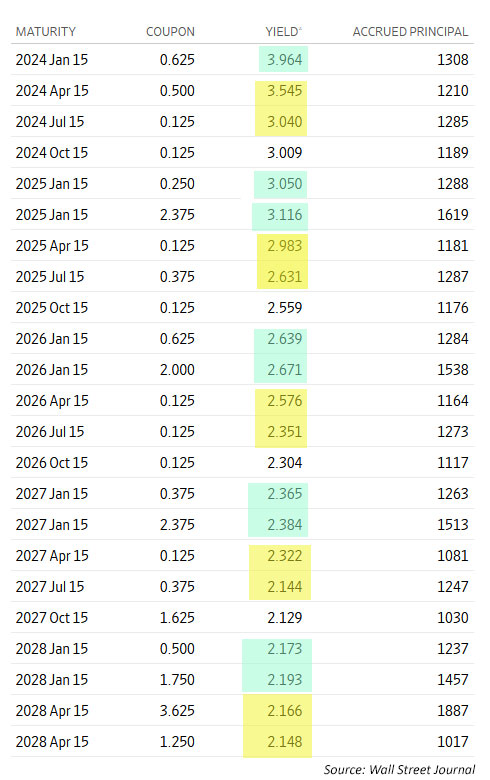
Real yields as of Sept. 8, 2023.
In all these issues through 2028, the January TIPS (highlighted in green) has a higher inflation accrual and generally a higher coupon rate than the TIPS maturing in April and July of the same year. And that tends to push the real yield higher. So at this point, do the TIPS maturing in January look relatively more attractive? I’d say yes, but that’s a quick observation.
But if you take a careful look at this chart, you can see that the TIPS maturing in April of each year consistently have a higher real yield to maturity than the TIPS maturing in July, even with the variance in coupon rates and accrued inflation. That is evidence of the “NSA effect” because the TIPS maturing in July gets the benefit of generally higher NSA from January to May.
Is NSA deflation concerning?
Ashton points out that inflation derivative markets are pricing in slight deflation through the end of the year.
The answer is it’s not terribly unusual to see NSA deflation especially when inflation is kind of low in those last four months of the year. … What the SWAP market is telling you is yes, inflation is expected to be unchanged or slightly lower. … But once you seasonally adjust those numbers you get something like a 2.2% annualized rate.
I Bond investors are less affected by these seasonal skews because the rate-setting periods for I Bonds — April to September and then October to March — cross through the high months and low months and more or less balance out.
Last year, for example, non-seasonal inflation ran at -0.10% in November and -0.31% in December and then jumped to 0.80% in January and 0.56% in February 2023.
The main take-away is to realize that inflation-protected investments are are tied to non-seasonally adjusted inflation and not the headline number you see reported each month. And that will mean some ups and downs across the year, but it all balances out after 12 months.
* * *
Feel free to post comments or questions below. If it is your first-ever comment, it will have to wait for moderation. After that, your comments will automatically appear. Please stay on topic and avoid political tirades.
David Enna is a financial journalist, not a financial adviser. He is not selling or profiting from any investment discussed. I Bonds and TIPS are not “get rich” investments; they are best used for capital preservation and inflation protection. They can be purchased through the Treasury or other providers without fees, commissions or carrying charges. Please do your own research before investing.
One of the very first Treasury Inflation-Protected Securities I ever bought — CUSIP 912810FH6 — was auctioned on April 7, 1999, with a real yield to maturity of 3.899% and a coupon rate of 3.875%. I still own that little gem, which has racked up an inflation index of 1.85668 on its way to a maturity date of April 15, 2029.
As great as that investment was, it spoiled me. Real yields didn’t hang near 4.0% for long. Soon we were seeing 2.7%, then 2.5% then 2.0%. Those were still great real yields, but not my highly coveted 3.899%. So I lost interest in TIPS for awhile.
Now, after more than a decade of very low and even negative real yields on TIPS, we are again back to a 2.0% real yield across nearly the entire TIPS maturity spectrum. I’ve been investing aggressively at these yields, but there is always the question: Are we arriving at a “new normal”? Here is where we stand today:
Does this look normal? I’d say “not at all,” because this yield curve is extremely flat. In normal times, you’d expect longer-term yields to be higher than shorter-term yields. To get to normal, either the longer-end needs to rise or the shorter end needs to fall.
But then, what is “normal”? I don’t know the answer; I wish I did. Can recent history tell us? I looked back through real yield information compiled by the Federal Reserve Bank of St. Louis, with daily real yield estimates dating back to 2003 for the 5- and 10-year TIPS; 2004 for the 20-year; and 2010 for the 30-year.
Can charts tell the story?
In each of the following charts you will note the spike higher in real yields during the financial crisis of late 2008 and then again in the pandemic distress of March 2020. In both those cases, panicked investors were selling everything. Yields returned to more typical levels relatively quickly.
But after each of those market panics, the Federal Reserve reacted with aggressive quantitative easing (bond buying that pushed yields down) and slashes to short-term interest rates, resulting in a near 0.0% return on safe investments.
So the case can be made that the entire period from 2008 to 2022 was not normal, subject to aggressive market manipulation by the Federal Reserve. That era ended in March 2022, when the Fed abandoned quantitative easing and began raising short-term interest rates, first slowly and then aggressively.
Here are the charts:
Click on image for a larger version.
During the 2022 to 2023 cycle of Federal Reserve tightening, the 5-year real yield has been the quickest to respond to short-term rate increases and has been lingering around 2.0% since early July 2023. But as you can see in the chart, the 5-year has rarely broken through the 2.0% real-yield barrier at other times back to 2003.
My guess: The “normal” real yield of a 5-year TIPS appears to be in the range of 1.25% to 2.0%.
Click on image for a larger version.
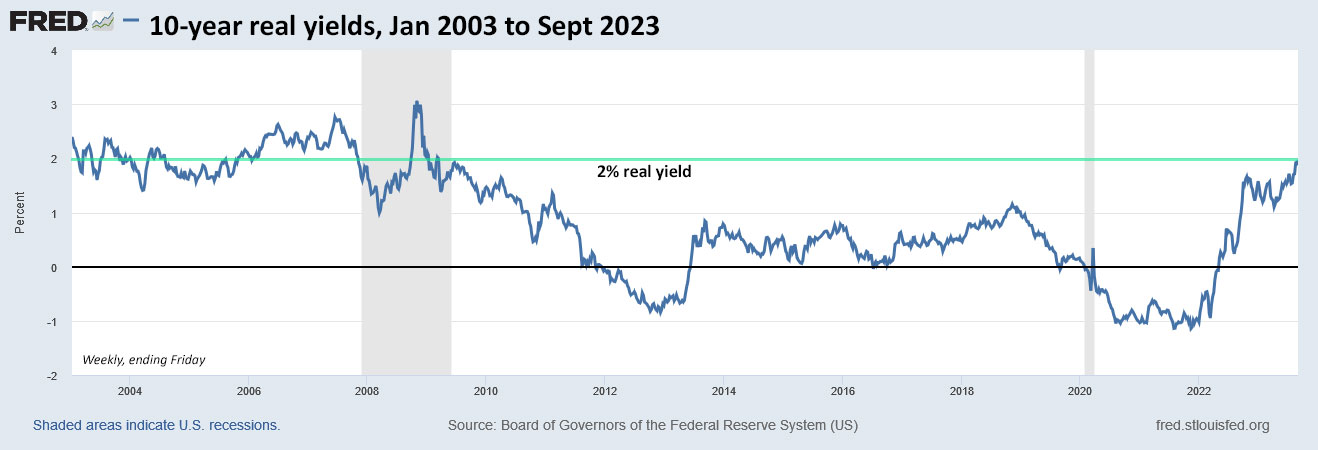
Surprisingly, 10-year real yields have been slow to creep up to the 2.0% level, but on Wednesday the most recent issue of this term was trading at 2.0% on the secondary market. Note that a real yield around 2.0% was common for the 10-year before the financial crisis of 2008.
My guess: A “normal” 10-year real yield appears to be in a range of 1.5% to 2.2%.
Click on image for a larger version.
FRED’s tracking of the 20-year real yield dates back to 2004. Note that in the four years before the 2008 financial crisis, the 20-year real yield ran very close to — or well above — the 2.0% barrier.
My guess: It’s possible that 1.8% to 2.2% could be a baseline “normal” real yield for a 20-year TIPS.
Click on image for a larger version.
FRED’s records for 30-year TIPS only go back to 2010 — two years after the turmoil of the financial crisis — so it’s hard to draw any conclusions. The Treasury did not issue 30-year TIPS from October 2001 tot February 2010. I consider the early years of these long-term TIPS, from 1998 to 2001, to be unreliable as a gauge for a “normal” 30-year real yield. Over that time, auctioned real yields ranged from 3.4% to 4.1%. I don’t think we are returning to those “glory days.”
My guess: I’d think that 2.0% to 2.25% could a baseline normal yield for a 30-year TIPS.
Can the U.S. economy handle this?
It has been surprising to see the U.S. economy continue to hum along even as short- and long-term interest rates have increased 300 to 500 basis points. No one seemed to expect this; the recession was supposed to start months ago. But because it hasn’t, the Federal Reserve has kept up the fight against inflation.
Bloomberg this week posted an article theorizing that the surge in U.S. interest rates could hamper the U.S. economy for at least a decade. From the article:
Central bank interest-rate increases reduce potential economic output for at least 12 years, in contrast to traditional theories of national economies that assume policy is neutral in the long run, Federal Reserve Bank of San Francisco research found. … For example, in response to a 1% interest-rate increase, real gross domestic product would be about 5% lower after 12 years than it would otherwise be, the researchers found.
In other words, the U.S. economy will feel pain as interest rates rise after years of near-zero yields on safe investments. But those yields were artificially created through Fed manipulation. The yields we are seeing in September 2023 are rising to historically valid levels, with almost no Fed manipulation on mid- to longer-term Treasurys.
The long view
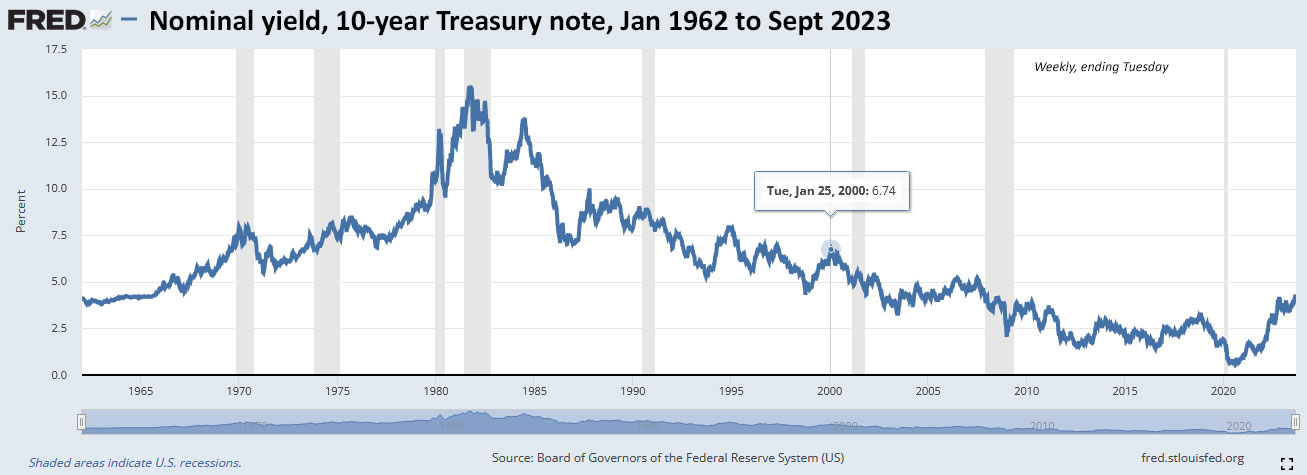
The St. Louis Fed does track nominal 10-year yields all the way back to 1963, so you can get a better idea of the massive fluctuations in yields over the last 60 years, a period that included an intense battle against raging inflation that lasted into the early 1980s. Here is the chart:
Click on image for larger version.
I highlighted the 6.74% yield in January 2000, which marked the last period the nominal 10-year was yielding more than 6%. On Jan. 12, 2000, a 10-year TIPS auctioned with a real yield of 4.338%. Oh, and by the way, the U.S. inflation rate in January 2000 was 2.7%.
I note this because I’ve seen recent commentary (such as this from Bloomberg) suggesting that the the 10-year note could be heading to 6%. For example:
That’s an eye-popping figure. And Kaminski acknowledged that we’re coming off a “decade of really low interest rates.” But we’ve seen 6% rates before, she said, “so it’s not strange to think that we may have higher rates if we have surprises to the upside in inflation later in the fall.”
We are normalizing, but at this point we don’t know what the “new normal” is. How high can real yields go? Will we overshoot to the high side? And, can it last?
Do I know? Of course not. But it is clear that today’s real yields of 2.0% above inflation are historically attractive.
Feel free to post comments or questions below. If it is your first-ever comment, it will have to wait for moderation. After that, your comments will automatically appear. Please stay on topic and avoid political tirades.
David Enna is a financial journalist, not a financial adviser. He is not selling or profiting from any investment discussed. I Bonds and TIPS are not “get rich” investments; they are best used for capital preservation and inflation protection. They can be purchased through the Treasury or other providers without fees, commissions or carrying charges. Please do your own research before investing.


They did reply and quickly, the next day in fact. However no illumination on what the future holds: Hello Matthew,…