
By David Enna, Tipswatch.com
I often caution readers about “non-seasonally adjusted inflation” and how it can create confusion and even distress as it sometimes skews away from headline inflation, the number you see reported each month.
Non-seasonally adjusted inflation is important for investors in Treasury Inflation-Protected Securities (where it is used to adjust principal balances each month) and U.S. Series I Savings Bonds (where it is used to set future variable interest rates).
Each month, the Bureau of Labor Statistics includes a paragraph deep down in its CPI report (this one is for July inflation):
Not seasonally adjusted CPI measures
The Consumer Price Index for All Urban Consumers (CPI-U) increased 3.2 percent over the last 12 months to an index level of 305.691 (1982-84=100). For the month, the index increased 0.2 percent prior to seasonal adjustment.
Once the inflation report is issued, I plug that number into the mega-chart on my Inflation and I Bonds page:

This chart shows you two things: 1) non-seasonally adjusted inflation ran at 0.19% in July (not the rounded 0.2% reported by the BLS) and that means principal balances for all TIPS will increase 0.19% in September. And 2) Four months into the I Bond’s rate-setting period, inflation has run at 1.28%, with two months remaining. The I Bond’s new variable rate — to be reset November 1 — appears to be heading toward a range of 3.2% to 3.4%.
What is this NSA inflation?
A new podcast from Michael Ashton, known around the financial world as the “Inflation Guy,” takes a crack at explaining non-seasonally adjusted inflation (NSA) in plain English. Although this is an esoteric, inside-baseball topic — and Ashton actually uses baseball as an analogy — it’s important for investors in TIPS and I Bonds to understand the basics of NSA. Take a listen:
In his intro, Ashton notes that the inflation derivatives market is suggesting that U.S. inflation will decline from August to December 2023. He notes:
Does this mean that deflation is upon us? No, and the reason why is something called ‘seasonal adjustment.’ It turns out that seasonal adjustment is critically important for inflation markets, and the market’s pricing is not nearly as outlandish as it looks.
Ashton clarifies something that I have noticed and written about over the years: that NSA tends to run higher than seasonally-adjusted ‘headline’ inflation from January to June, and then lower from July to December. At the end of 12 months, both NSA and seasonally-adjusted inflation will match. So if you run higher in the first half of the year, you’ll run lower in the second half.
He notes that the average investor has no interest in NSA versus official inflation, but investors in TIPS and I Bonds do:
Inflation people definitely care, because what gets traded in the market, what TIPS are based on, is non-seasonally adjusted inflation, whereas the number that gets reported, the headline number, is seasonally adjusted. ….
We know that prices have a strong tendency to fall in December, so we can adjust that number and then when see the official CPI report the December number is no more likely to be negative than any other CPI number.
The reality is that prices did decline in that particular December, so bonds tied to inflation ought to reflect the reality, not the seasonally adjusted reality.
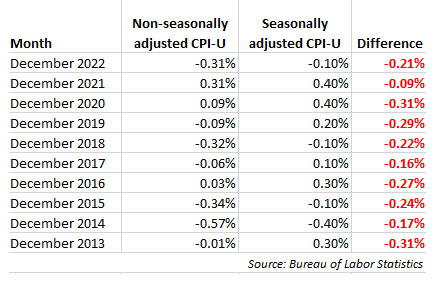
This isn’t just a “theoretical” premise — in fact, non-seasonally adjusted inflation consistently runs lower in December than the official seasonally adjusted number.
So, what does this mean for investors of inflation-protected products? The key thing is to recognize that your inflation expectations could take a temporary dive toward the end of the year.
For TIPS investors, the December number sets inflation index for the month of February. As Ashton points out, that means that a TIPS maturing in January (with inflation accruals set by inflation through November) could logically have a lower real yield to maturity than a TIPS maturing in April (with inflation accruals including the month of December). He says:
If you look at a whole list of TIPS, the whole TIPS yield curve, you’ll notice that TIPS that mature in April very often have slightly higher yields than similar maturity bonds that mature in January or July. … You’ll get these little bumps every April.
Given a choice between those two bonds, I’d always rather have the January maturity that doesn’t have to experience that print that I am pretty sure is going to be negative. So investors have to be compensated to hold the April maturity.
This doesn’t always hold up in reality, because TIPS have a lot of factors affecting real yield to maturity. A TIPS with a very high inflation accrual and high coupon rate will generally draw a slightly higher real yield than one with a low inflation accrual and discounted price. Plus, today’s TIPS market is skewed toward higher yields on shorter maturities.
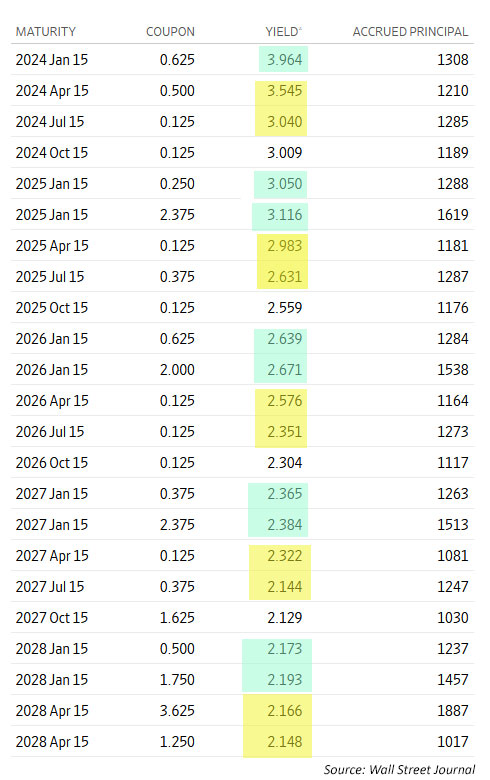
In all these issues through 2028, the January TIPS (highlighted in green) has a higher inflation accrual and generally a higher coupon rate than the TIPS maturing in April and July of the same year. And that tends to push the real yield higher. So at this point, do the TIPS maturing in January look relatively more attractive? I’d say yes, but that’s a quick observation.
But if you take a careful look at this chart, you can see that the TIPS maturing in April of each year consistently have a higher real yield to maturity than the TIPS maturing in July, even with the variance in coupon rates and accrued inflation. That is evidence of the “NSA effect” because the TIPS maturing in July gets the benefit of generally higher NSA from January to May.
Is NSA deflation concerning?
Ashton points out that inflation derivative markets are pricing in slight deflation through the end of the year.
The answer is it’s not terribly unusual to see NSA deflation especially when inflation is kind of low in those last four months of the year. … What the SWAP market is telling you is yes, inflation is expected to be unchanged or slightly lower. … But once you seasonally adjust those numbers you get something like a 2.2% annualized rate.
I Bond investors are less affected by these seasonal skews because the rate-setting periods for I Bonds — April to September and then October to March — cross through the high months and low months and more or less balance out.
Last year, for example, non-seasonal inflation ran at -0.10% in November and -0.31% in December and then jumped to 0.80% in January and 0.56% in February 2023.
The main take-away is to realize that inflation-protected investments are are tied to non-seasonally adjusted inflation and not the headline number you see reported each month. And that will mean some ups and downs across the year, but it all balances out after 12 months.
* * *
Feel free to post comments or questions below. If it is your first-ever comment, it will have to wait for moderation. After that, your comments will automatically appear. Please stay on topic and avoid political tirades.
David Enna is a financial journalist, not a financial adviser. He is not selling or profiting from any investment discussed. I Bonds and TIPS are not “get rich” investments; they are best used for capital preservation and inflation protection. They can be purchased through the Treasury or other providers without fees, commissions or carrying charges. Please do your own research before investing.


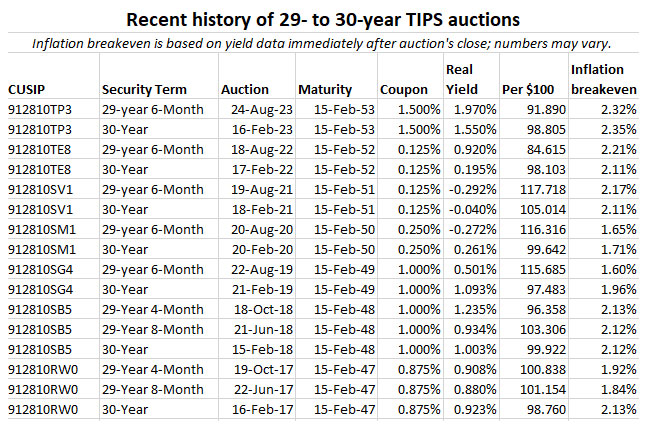

Dongchen, I always say that the inflation breakeven rate reflects sentiment but is a fairly lousy predictor of future inflation.…