
And of course, because it’s TreasuryDirect, it’s complicated.
By David Enna, Tipswatch.com
If you hold Treasury issues of any kind (except possibly Savings Bonds) at TreasuryDirect, you should be getting a friendly email this week. It will say something like:
TreasuryDirect 1099 Statement Information
Dear Account Owner: Please check the Investor InBox section of your TreasuryDirect account and all linked accounts, if applicable, for important tax information.
OK, so there you go. No clickable link, which is probably a good idea in a time of escalating phishing attempts. But there is one link in the email, to a 2-minute video explaining how to find and print the 1099s for your main and linked TreasuryDirect accounts:
The video is fine, but it does end abruptly in the middle of a sentence, and makes no attempt to explain what you will actually see in the 1099s. If you hold Treasury Inflation-Protected Securities at TreasuryDirect, or if you have had maturing TIPS, there could be some complications. I’ve had many readers tell me they couldn’t find the 1099-INT for TIPS, and that they didn’t even know a 1099-OID exists, or what it is. These forms are there.
TreasuryDirect is NOT going to mail you these forms. You need to hunt them down.
Note: If your only holdings at TreasuryDirect are I Bonds or EE Bonds, and you didn’t have any matured or redeemed savings bonds in 2022, you won’t find 1099s for that year. Those savings bonds earn tax-deferred interest by default, and so there are no tax forms unless you redeemed an issue or had it mature.
1099 hunt: Step-by-step process
1. Log into your TreasuryDirect account. Simple enough, right? Yes, if you remember your password and can clear the two-step verification.

2. Go to ManageDirect. Once you log in, you will notice you have a message in your Inbox, which informs you the 1099s are available:
To view a summary of your taxable transactions, and to print your 1099, please access your account and go to the ManageDirect tab, then click the appropriate tax year under the heading “Manage My Taxes.”
Important: Once you are inside the account section of TreasuryDirect, never click on your browser’s back button. If you do, you will be booted out of TreasuryDirect and you will have to log in again. To navigate, either click on the top row of tabs or click “return” at the bottom of most pages.
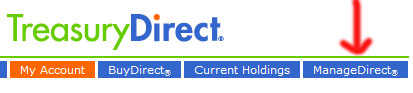
To get to ManageDirect from the account home page, click on “ManageDirect” in the top row of tabs:
3. Click on ‘Year 2022’ in the Manage My Taxes section, bottom left.
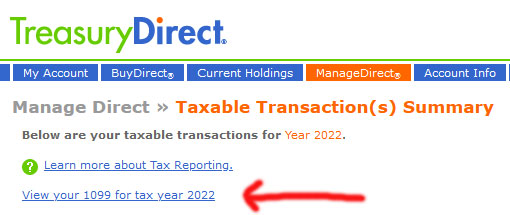
This is what the ManageDirect page looks like. Click on “Year 2022” under “Manage My Taxes.”

4. Click on ‘View your 1099 for tax year 2022’ When the Year 2022 page opens, you will see a lot of information about every transaction in 2022, but what you want is the 1099, not this listing. So find the tiny little link to your 1099 and click.
5. Successfully respond to the security question. Yes, one more step before you get to the 1099. You have to answer the security question. This can be difficult if you created your account 20 years ago and your taste in movies has advanced since then …

Sometimes the security question is: “You were born in what city?” … A bit easier to answer.
6. Bingo! Your 1099 now opens. But this is not like any 1099 you’d see from any other bank or brokerage. It is long-winded (mine was 11 printed pages) and not really crystal clear. But thank God the form complies with “Paperwork Reduction Act Notices.”

7. Print it. There is no print button on this page. To print it from your computer, click on the page and then do a “CONTROL P.” (Or on a Mac, “Command P.”) That should open your computer’s print menu. If that doesn’t work, you could copy the entire thing into a Word document and then print that.
Form 1099-INT
If you hold TIPS at TreasuryDirect, you will have at least two 1099s included in these pages: 1099-INT for the coupon interest you earned, and 1099-OID for taxable inflation accruals you received in 2022. Here is what the opening lines of form 1099-INT look like.
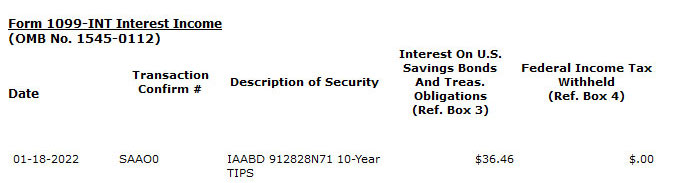
At the very end of the 1099-INT listing, you will see the total. On your tax return, this will be entered into Box 3 on the form for 1099-INT. Correct me if I am wrong. The definition of Box 3:
The information displayed above in the 1099-INT section shows interest paid to you for tax year ending 12-31-2022. … Shows interest on U.S. Savings Bonds, Treasury Bills, Treasury Notes, Treasury Bonds and Treasury Inflation-Protected Securities (TIPS). … This interest is exempt from state and local income taxes.
Form 1099-OID
Inflation accruals for TIPS held in a taxable account are taxable in the year they were accrued, even though they were not yet paid out. These accruals are tallied in 1099-OID, with OID standing for Original Issue Discount. These are listed in another section of the 1099, and here is what the top looks like:
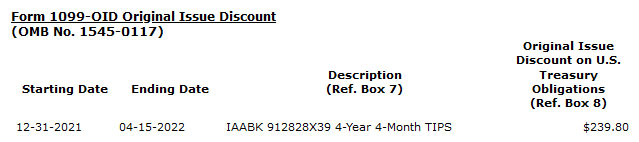
At the bottom is the total, which is entered into Box 8 of the 1099-OID section of your tax return. And here is the TreasuryDirect definition:
Original issue discount (OID) is the excess of an obligation’s stated redemption price at maturity over its issue price. OID on a taxable obligation is taxable as interest over the life of the obligation. If you are the holder of a taxable OID obligation, you generally must include an amount of OID in your gross income each year you hold the obligation.
For Box 8: Shows OID on a U.S. Treasury obligation for the part of the year you owned it. Report this amount as interest income on your federal income tax return. … This OID is exempt from state and local income taxes. If the number in this box is negative, it represents a deflation adjustment.
Form 1099-B
If you had a Treasury issue that matured in 2022, you may find tax information in this section, as I did for a TIPS that matured April 15, 2022. I bought that TIPS at a Dec. 21, 2017, reopening. It had a discounted price of $98.96 for $100 of value. So apparently this triggered a very small long-term capital gain. Here is how TreasuryDirect shows this, with the amounts hidden:

TreasuryDirect says these proceeds should be reported to the IRS on form 8949, part D, which is for a long-term gain, but the gain goes in Box 1f, which is for an adjustment to a gain. All of this is a bit of a mystery to me and I don’t recall getting a 1099-B in the past. But the amount is quite small. I’ll let TurboTax handle this.
What about a conventional brokerage?
I have no idea how forms 1099-INT and 1099-OID for TIPS are handled at a typical brokerage, because all my TIPS holdings at a brokerage are in a tax-deferred account. If others have information, provide it in the comments section below.
Final thoughts
It should be obvious at this point that I am no tax expert, so nothing you just read should be considered tax advice. Still, getting these 1099s from TreasuryDirect is EXTREMELY IMPORTANT. You are going to get one email with a fairly cryptic message. That’s it. Nothing in the mail. No easy-to-read tax summary like you receive from your broker. It’s up to you to go to TreasuryDirect, find the 1099s, print them, decipher them and report them on your tax return for 2022.
Happy hunting.
• Confused by TIPS? Read my Q&A on TIPS
• TIPS in depth: Understand the language
• Upcoming schedule of TIPS auctions
* * *
Feel free to post comments or questions below. If it is your first-ever comment, it will have to wait for moderation. After that, your comments will automatically appear.Please stay on topic and avoid political tirades.
David Enna is a financial journalist, not a financial adviser. He is not selling or profiting from any investment discussed. I Bonds and TIPS are not “get rich” investments; they are best used for capital preservation and inflation protection. They can be purchased through the Treasury or other providers without fees, commissions or carrying charges. Please do your own research before investing.


It has been said that all wars are wars of religion. Our country is based on Judeo-Christian principals, along with…