
TreasuryDirect’s information often confuses investors. There is another way.
By David Enna, Tipswatch.com
Almost every week, I get questions about the way TreasuryDirect shows the current value of I Bonds purchased within the last five years. Here are recent examples:
“I-Bond was purchased last April. So far … the actual annual earning rate is not 7.12% as we saw last April but low. Is it because the current holding has not included the last 3 month interest? Can you explain it? Thank you.”
… “I invested $10,000 on 6/13/22 and I only gained $156 in value on 11/1/22. That seems low given that the interest rate was 9.62%. Help!”

The usual advice. You can check the total value of your Series I Savings Bonds after logging into TreasuryDirect’s account pages and then clicking through to the totals for the individual bonds. Or you can use the Treasury’s Savings Bond Calculator, which TreasuryDirect claims is only for paper I Bonds (maximum amount of $5,000 each) and isn’t accurate for electronic I Bonds. But it is accurate for electronic bonds, you just have to double the $5,000 amounts for purchases of $10,000 in that form.
I wrote a step-by-step guide to using the Savings Bond Calculator back in June 2018, and I think the basics remain just about the same. One of the advantages of using the calculator is that it creates a browser-based file you store on your computer. It can be updated without actually logging in to TreasuryDirect, and then saved again.
Confusion arises when investors check account balances at TreasuryDirect — or use the Savings Bond Calculator — because they will not see the last three months of interest for I Bonds that have not been held five years. I’ve written about this several times, including this August 2022 article: “Don’t go ballistic over the way TreasuryDirect reports I Bond interest.”
But there is actually a very easy way to track the current value of your I Bonds, including those three months of interest that TreasuryDirect hides for recent purchases.
Eyebonds.info: A valuable resource
If you want to track the current value of your I Bond investment, Eyebonds.info is an excellent and reliable site. It’s a creation of Bob Hinkley, a retired corporate financial analyst and computer programmer (and famed Boglehead contributor). It’s very simple to use:
- Go to the homepage.
- Click on I Bonds.
- Find the month you purchased the I Bond in the table and click on it.
- Click on the investment amount listed below that matches your original investment.
The page that then displays the earned-interest history of your I Bond, all the way to the end of the your current composite rate (the end month depends on the month you purchased the I Bond). The numbers presented do not subtract the last three months of interest, so remember if you redeem early, you will lose those three months of interest.
Now, let’s run through some examples. In these examples, I am presenting results for a $10,000 investment in April of various years. The top section of each chart shows the Savings Bond Calculator’s presentation (doubled to match the $10,000 investment). The bottom section of each example comes from Eyebonds.info.

Example 1 is for a $10,000 I Bond purchased in April 2022. TreasuryDirect shows a value of $10,436, but that does not include the last three months of interest. The Eyebonds.info presentation shows a current value (as of Feb. 1, 2023) of $10,684 and continues with interest calculations through October 1. Note that the Eyebonds.info information for Nov. 1, 2022, matches TreasuryDirect’s calcuation, because it does not include interest for November, December and January.
Also, note that I Bonds earn interest for the previous month on the first day of each month. Don’t get confused by that. You don’t earn interest until the month is completed.

Example 2 is for a $10,000 I Bond purchased in April 2021. TreasuryDirect shows a value of $10,712, minus the three months interest. Eyebonds.info shows a current value of $10,968, which includes the last three months of interest through the end of January.
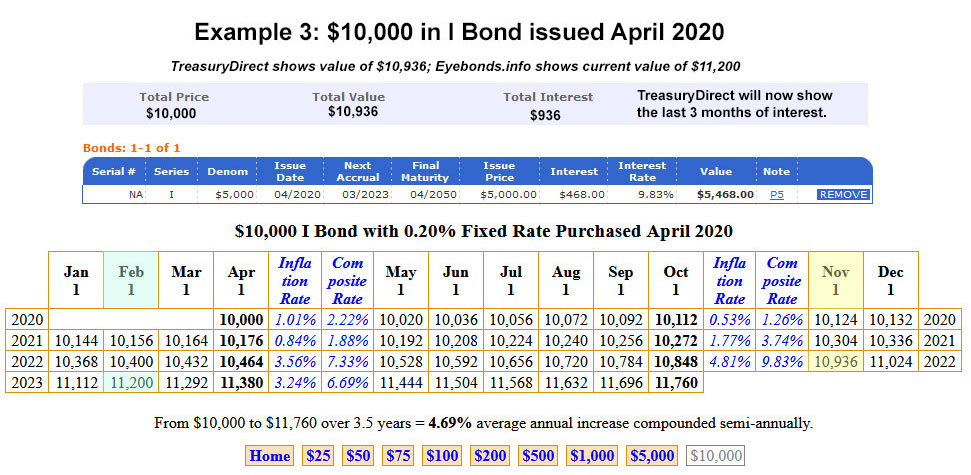
Example 3 is for a $10,000 I Bond purchased in April 2020. TreasuryDirect shows a value of $10,936, which excludes the last three months of interest. Eyebonds.info shows a Feb. 1 value of $11,200, which includes those three months of interest.
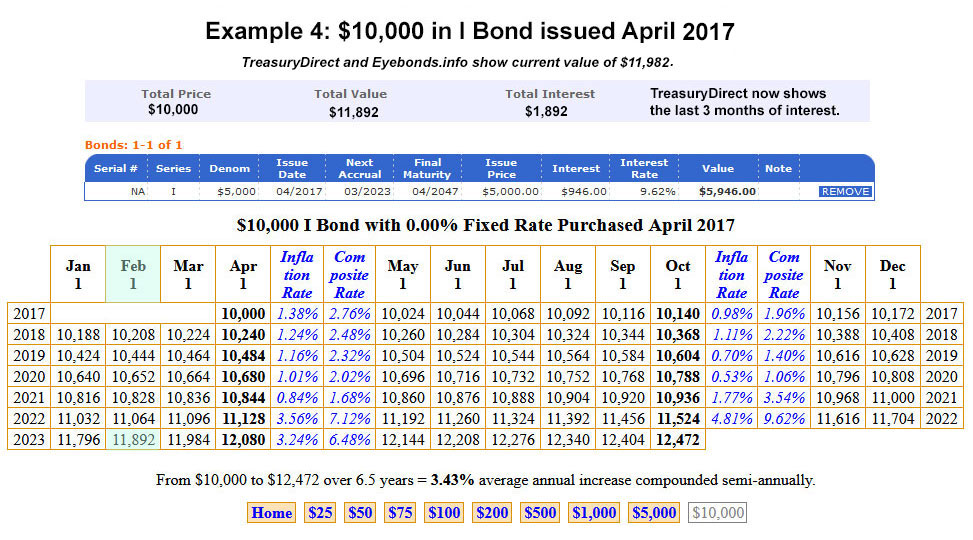
Example 4 is for an I Bond issued in April 2017, which has now passed the five-year holding period and is no longer subject to the three-month interest penalty. TreasuryDirect shows a February 2023 value of $11,892, exactly matching the information on Eyebonds.info because the interest penalty is no longer in effect.
TreasuryDirect’s reasoning
By eliminating (hiding, actually) the last three months of interest for I Bonds held less than 5 years, TreasuryDirect is attempting to cause less confusion, not more confusion. If it showed the full total, and investors redeemed early, they would swamp TreasuryDirect with complaints they were cheated. So TreasuryDirect focuses on presenting an accurate current redemption value, not current total value.
I’ve suggested that TreasuryDirect simply create two columns, one for redemption value and one for current value. That would really lessen investor confusion. But … that’s not happening.
Anyway, Eyebonds.info is a tremendous resource for tracking and understanding the current and near-future value of your I Bonds. It also has historical information on TIPS, and a treasure-chest of information on U.S. inflation dating back to 1971.
The site also has an Excel-based I Bond Calculator you can download. I haven’t used it, but a lot of my readers seem passionate enough (and nerdy enough?) to give it a try. Let me know how it works. For me, the Savings Bond Calculator and Eyebonds.info are all I really need.
• I Bonds: A not-so-simple buying guide for 2023
• Confused by I Bonds? Read my Q&A on I Bonds
• Let’s ‘try’ to clarify how an I Bond’s interest is calculated
• Inflation and I Bonds: Track the variable rate changes
• I Bond Manifesto: How this investment can work as an emergency fund
* * *
Feel free to post comments or questions below. If it is your first-ever comment, it will have to wait for moderation. After that, your comments will automatically appear.Please stay on topic and avoid political tirades.
David Enna is a financial journalist, not a financial adviser. He is not selling or profiting from any investment discussed. I Bonds and TIPS are not “get rich” investments; they are best used for capital preservation and inflation protection. They can be purchased through the Treasury or other providers without fees, commissions or carrying charges. Please do your own research before investing.


I faced the same situation before my "forced retirement." All my tax-deferred assets were in a 401k with limited options.…