
The Treasury will auction a reopened 10-year TIPS on Thursday. What’s the outlook?
By David Enna, Tipswatch.com
Real yields for Treasury Inflation-Protected Securities are starting to rise again, after falling dramatically in the aftermath of Russia’s invasion of Ukraine. With the Federal Reserve finally committing to raising short-term interest rates, these yields could continue rising higher, but nothing is certain.
This week, on Thursday, the U.S. Treasury will offer $14 billion in a reopening of CUSIP 91282CDX6, creating a 9-year, 10-month TIPS. Its coupon rate is 0.125%, which was set at the originating auction on January 20. This TIPS currently trades on the secondary market with a real yield to maturity of -0.76% and a price of about $108.99 for $100 of par value.
Definition: The “real yield” of a TIPS is its yield above or below official U.S. inflation, over the term of the TIPS. In more normal times, a 10-year TIPS would provide a real yield about 1% or more above inflation. So the current real yield of -0.76% means that CUSIP 91282CDX6 will trail U.S. inflation by 0.76.% for 9 years, 10 months.
Real yields have been on a roller-coaster ride in 2022, rising at the beginning of the year as the financial markets anticipated future actions by the Federal Reserve to raise short-term interest rates and cease purchases of U.S. Treasurys. But then those yields began plummeting in March with Russia’s invasion of Ukraine, and in recent days have rebounded higher as the Federal Reserve solidified its interest rate increases.
Keep in mind that 50-basis-point swings in 10-year real yields are relatively rare in a span of weeks. But here’s what we’ve seen in 2022 in the Treasury’s estimates for the real yield of a full-term 10-year TIPS:
- January 3: -0.97%
- January 20: -0.50%
- February 10: -0.42%
- March 1: -0.90%
- March 11: -0.94%
- March 18: -0.72%
At this point, I’d say 10-year real yields are more likely to move 30 to 50 basis points higher in upcoming months, instead of 30 to 50 basis points lower. But anything can happen, especially if the U.S. economy begins to show signs of weakness. That will flatten the yield curve; so even as the Fed raises short-term interest rates (often) in 2022 and 2023, long-term real yields could stabilize at stubbornly low rates.
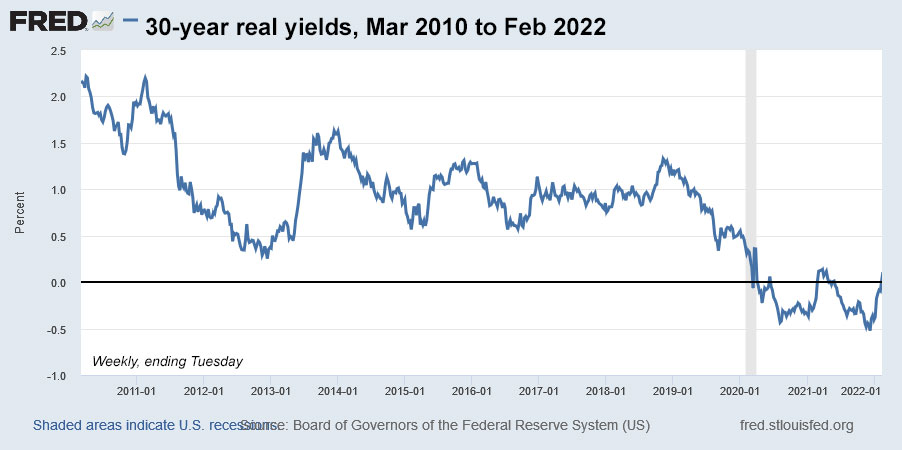
Here is the trend over the last decade in 10-year real yields. I believe this chart is important to study, because it shows that real yields rose — but erratically — from 2013 to 2018, a time of Fed tightening (either implied or actual), then crashed below zero in the wake of the Fed’s bond-buying stimulus after the pandemic surge of March 2020:

My opinion: We are at a point in this cycle where 10-year TIPS real yields remain unattractive, at least when considered in isolation. But there is another way of viewing 10-year TIPS …
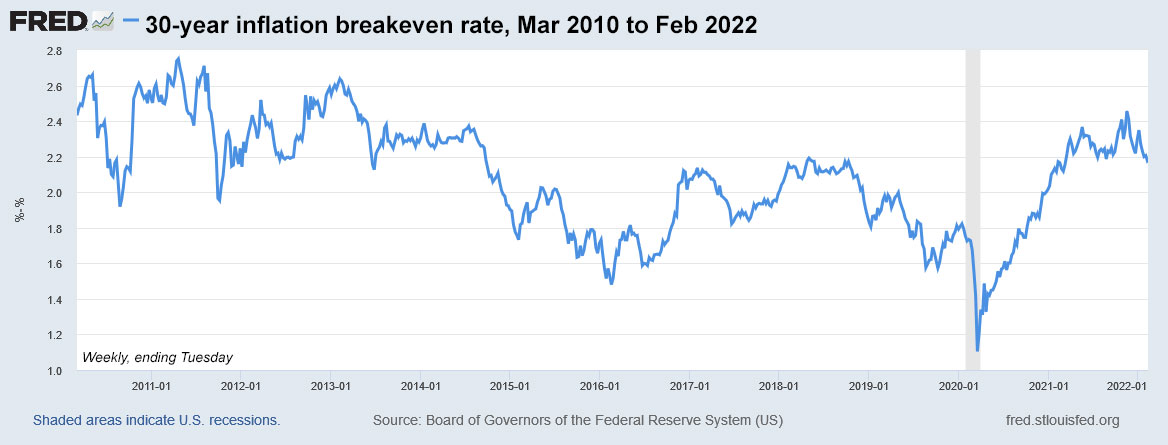
Inflation breakeven rate
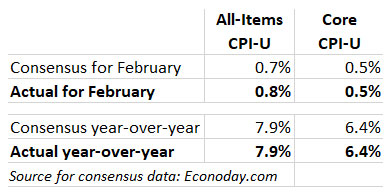
With a nominal 10-year Treasury note trading with a yield of 2.15%, CUSIP 91282CDX6 currently has an inflation breakeven rate of 2.91%, an all-time high or very close to it. This means the TIPS would out-perform a nominal Treasury if inflation averages more than 2.91% over the next 9 years, 10 months. U.S. inflation is currently running at 7.9%, but is likely to settle into a lower rate — say 4% to 5% — in upcoming months.
Will inflation average more than 2.91% over the next decade? If you answer yes, invest in the TIPS. If you say no, buy the nominal Treasury. (Side note: 10-year inflation has not averaged higher than 2.9% since the decade ending in 1998. But before that, from 1981 to 1998, every 10-year period had average inflation higher than 3.0%. Are we heading in that direction?)
Here is the trend in the 10-year inflation breakeven rate over the last decade, showing the wild swing lower during the early days of the pandemic outbreak, and steady rise higher as Federal Reserve and Congressional stimulus fired up the U.S. economy and sent inflation soaring:

What to expect at Thursday’s auction
You can track the price of CUSIP 91282CDX6 in real time on Bloomberg’s Current Yields page. As I noted earlier, it closed Friday with a real yield to maturity of -0.76% and a price of about $108.99 for $100 of value. It requires a hefty premium price because the real yield is well below the coupon rate of 0.125%, which is the lowest the Treasury will go for a TIPS.
This TIPS will carry an inflation index of 1.01396 on the settlement date of March 31, meaning that investors will pay an adjusted price about 1.4% higher than par value, but in return receive 1.4% in additional principal.
Let’s say you want to invest $10,000 in this TIPS. You will actually be purchasing $10,140 in accrued principal, and you will be paying a premium price of about 9%, for a total cost of about $11,053 for $10,140 of principal. That is a rough estimate, and things will change before Thursday’s auction.
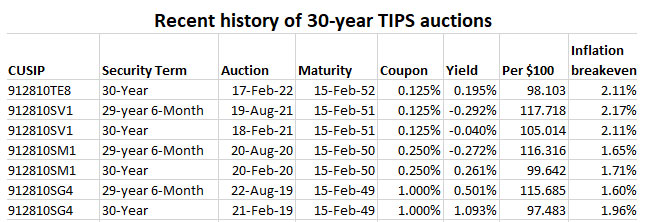
As an example, a similar auction in May 2021 got a real yield of -0.805% and the adjusted price was about $11,115 for $10,213 in value.
The auction closes at noon Thursday EDT for non-competitive bids, like those made at TreasuryDirect. If you are making a purchase through a brokerage, place your order either the night before or before 10 a.m. EDT Thursday, depending on your broker’s rules. After the auction closes at 1 p.m., I will post the results.
Here is a history of recent TIPS auctions of this term, showing the 11 consecutive auctions with negative real yields, beginning after the Covid surge in March 2020:

* * *
Feel free to post comments or questions below. If it is your first-ever comment, it will have to wait for moderation. After that, your comments will automatically appear.
David Enna is a financial journalist, not a financial adviser. He is not selling or profiting from any investment discussed. The investments he discusses can purchased through the Treasury or other providers without fees, commissions or carrying charges. Please do your own research before investing.


Thanks for the detailed explanation. I believe you are saying the "breakeven inflation rate" should reflect the inflation expectation rather…