

By David Enna, Tipswatch.com
Many of us here are strongly committed to holding investments in Treasury Inflation-Protected Securities to maturity. That means trading is not an issue, despite the temptations. It also means the “current market value” of a TIPS becomes a bit irrelevant.
So this opens a topic for debate: Which TIPS value should you follow more closely — current adjusted principal or current market value? This is a dilemma I wrote about last year in this post: The unique serenity of holding TIPS at TreasuryDirect.
A reader brought this back to my mind last week with this question:
I have a challenging time putting a proper “current value” on my TIPS ladder holdings. … I hold all my bonds to maturity. There-in lies the problem, when I go to make my semi-annual spreadsheet. Fidelity shows a value that marks-to-market daily each holding. Since I’m a “hold to maturity” only investor, that valuation doesn’t represent the value to me of that holding.
I think a proper “hold to maturity” current valuation to me is the current inflation adjusted principal. Is this a good “current value” accounting for a “hold to maturity” investor?
That sums it up perfectly. TreasuryDirect shows only one valuation for TIPS: par value x inflation index as of the last coupon payment. This provides an update on the growing amount you will receive when the TIPS matures. It is a legitimate view of value. Key point: TreasuryDirect does not allow tax-deferred accounts and you can’t sell your TIPS on that platform.
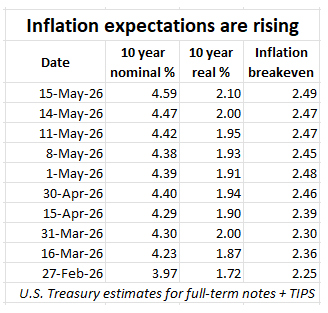
Your brokerage account shows market value, which rises and falls with changes in real yields, along with daily inflation accruals. This is also a legitimate view of value, and is crucial for determining RMDs if you are holding TIPS in a tax-deferred account. Also, since you can sell a TIPS at a brokerage, market value shows the potential value for a sale.
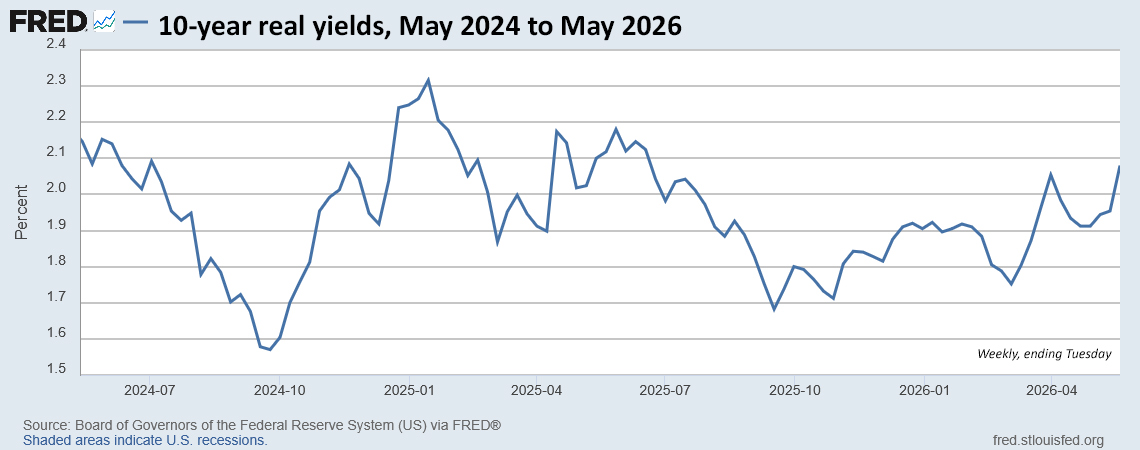
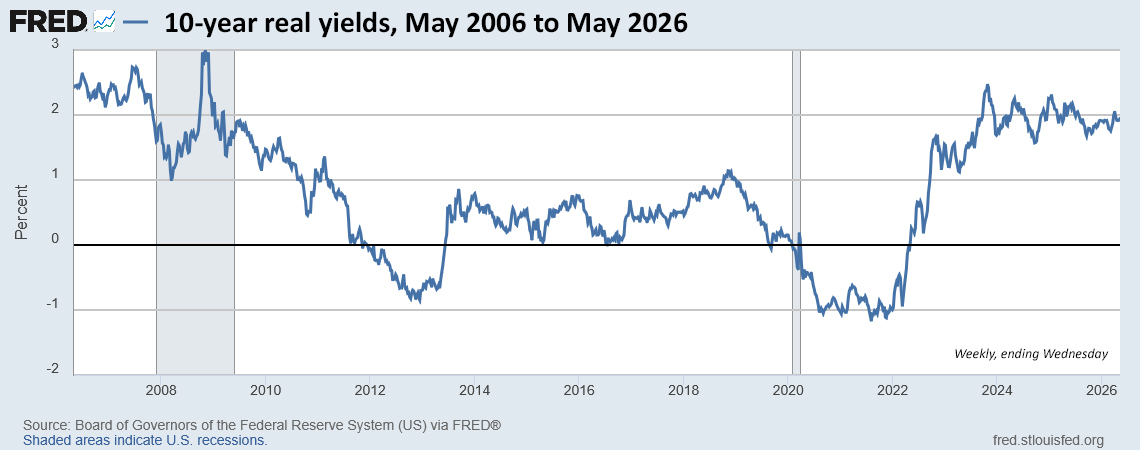
At this point, because longer-term TIPS real yields are at 15-year highs, market values for most TIPS are well below accrued principal. The difference is rather stunning for a multi-year ladder of TIPS, as shown in this example:
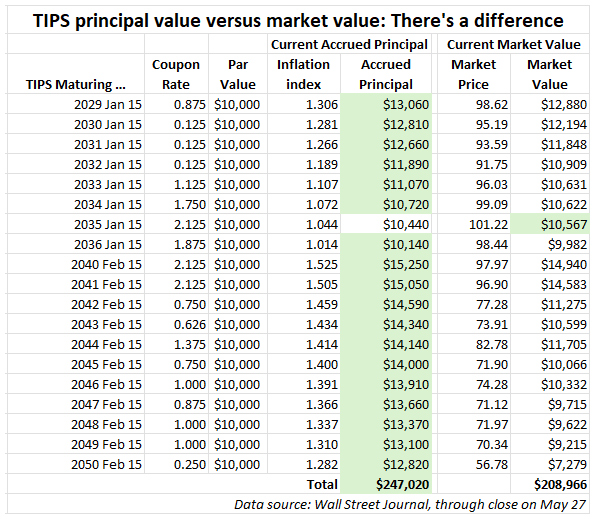
Keep in mind that as a TIPS nears maturity, market value becomes less and less relevant. It disappears at maturity and the final pay-out is: par value x inflation index, plus one last coupon payment.
The chart shows a simple way to calculate current principal using Excel. You just need to know par value and the current inflation index, which gets updated daily on this Wall Street Journal page, outside the paywall.
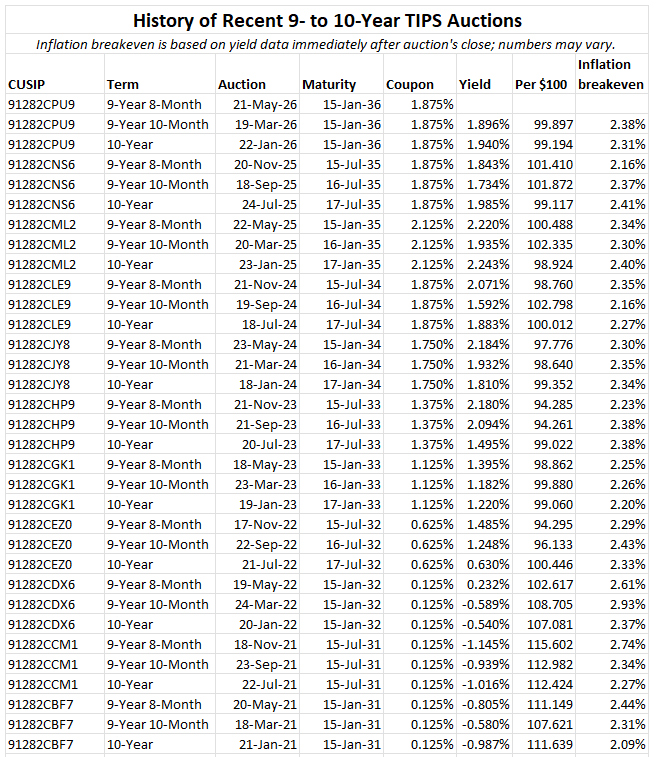
The chart also demonstrates why June 2026 is an excellent time to build a long-term ladder of TIPS. You can grab a lot of accrued principal at a discounted price. The negatives are: 1) the principal above par is not protected against deflation (a minor risk) and 2) the cash flow from coupon income won’t be stellar.
At Tipsladder.com, you can run through ladder scenarios. Right now, according to the site, you can build a 30-year ladder with a composite real yield of 2.50% and a safe withdrawal rate of 4.7%.
I Bonds? Not an issue
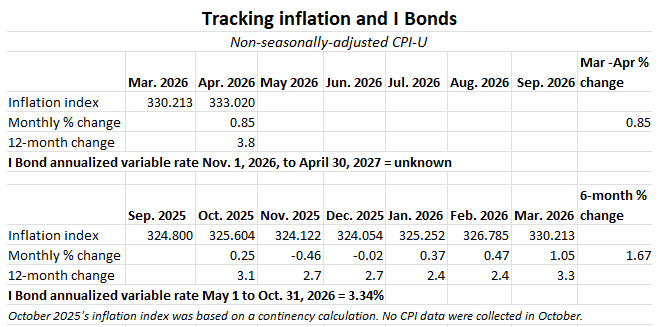
Series I Savings Bonds can never go down in value and cannot be traded on the secondary market. There is no “market value.” They have only one value to track: current adjusted principal, which changes on the first day of each month. TreasuryDirect will show you that current value, which you can also see using the Savings Bond Calculator or data from EyeBonds.info.
Correct answer?
As much as I would like to, I can’t ignore market value because most of my TIPS holdings are in a tax-deferred account subject to RMDs, which are based on market value at the end of the year. Also, your brokerage has to track market value because it changes daily, and some investors want to trade out of TIPS.

I am fine with seeing market value in the brokerage account. But I also keep an Excel spreadsheet showing the accrued principal for each TIPS, and I use that amount to balance out the years in my TIPS ladder. (I update the spreadsheet a few times a year.) The accrued principal will continue adjusting for inflation until maturity, so it does represent future inflation-adjusted cash flow.
Using the Excel method creates the illusion of a zero-duration bond with no interest-rate risk, similar to tracking an I Bond. Many Bogleheads freak out when I suggest this and yes, they are right. There is interest rate risk (or potential gain) if you want to trade out of TIPS.
Since I am not going to sell a TIPS before maturity, this is the multiverse reality I prefer.
Just to be clear, I am not a big fan of the multiverse trend in movies, especially Marvel movies, where it is way overused. But here is a multiverse treat, the closing credits theme from Loki season 1, episode 5, by the fantastic composer Natalie Holt. (She wrote different closing themes for every episode. Talk about multiverse!) This is one of my favorites of all time:
• Now is an ideal time to build a TIPS ladder
• Confused by TIPS? Read my Q&A on TIPS
• TIPS in depth: Understand the language
• TIPS on the secondary market: Things to consider
• TIPS investor: Don’t over-think the threat of deflation
• Upcoming schedule of TIPS auctions
—————————

Donate? This site is free and I hope to keep it that way. Some readers have suggested having a way to contribute. I welcome donations, any amount. And FYI, ads on this site pay for about one visit to Costco.
—————————
Follow Tipswatch on X for updates on daily Treasury auctions and real yield trends (when I am not traveling).
Feel free to post comments or questions below. If it is your first-ever comment, it will have to wait for moderation. After that, your comments will automatically appear. Please stay on topic and avoid political tirades. NOTE: Comment threads can only be three responses deep. If you see that you cannot respond, create a new comment and reference the topic.
David Enna is a financial journalist, not a financial adviser. He is not selling or profiting from any investment discussed. I Bonds and TIPS are not “get rich” investments; they are best used for capital preservation and inflation protection. They can be purchased through the Treasury or other providers without fees, commissions or carrying charges. Please do your own research before investing.

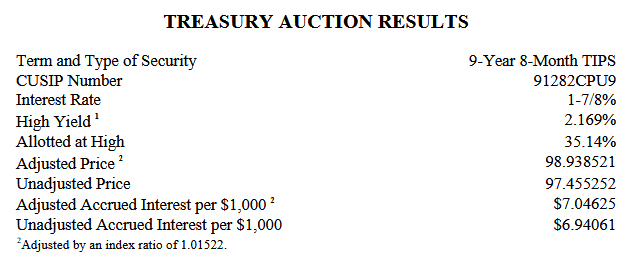

I made a small addition to my TIPS at auction, and the real yield works for me. I didn’t watch…