Where is the I Bond’s composite rate heading in November?

By David Enna, Tipswatch.com

We are halfway through the I Bond’s interest-rate-setting period, with the next reset coming on Nov. 1 — or more probably on Halloween Day, Oct. 31. On that day, the U.S. Treasury will announce both a new fixed rate and inflation-adjusted variable rate for the U.S. Series I Savings Bond.

The I Bond’s current annualized composite rate is 4.28%.

The new fixed rate will apply to I Bonds purchased from November 2024 through April 2025. The fixed rate is crucial because it remains with the I Bond until it is redeemed or matures in 30 years.

The inflation-adjusted variable rate will apply to all I Bonds for six months, no matter when they were purchased. When combined with the fixed rate, it forms the I Bond’s composite rate. As things stand today:

  • I Bonds purchased through October 2024 have a fixed rate of 1.3%.
  • The current variable rate is 2.96%.
  • And that creates an annualized composite rate of 4.28% for six months.

Now the bad news …

It’s early to make a projection, but after looking at the numbers I would guess that both the I Bond’s fixed rate and variable rate will be falling at the November reset. A lot will depend, of course, on where real yields (which are currently falling) and non-seasonally-adjusted inflation (also falling) end up in the next three months.

The fixed rate

The Treasury has no announced formula for setting the I Bond’s fixed rate. TreasuryDirect provides only this cryptic information:

The Secretary of the Treasury, or the Secretary’s designee, determines the fixed rate. The rate is based on market rates that have been adjusted to account for the value of components unique to savings bonds. These include the early redemption put option, tax deferral feature, deferred purchase feature, and Treasury’s administrative costs.

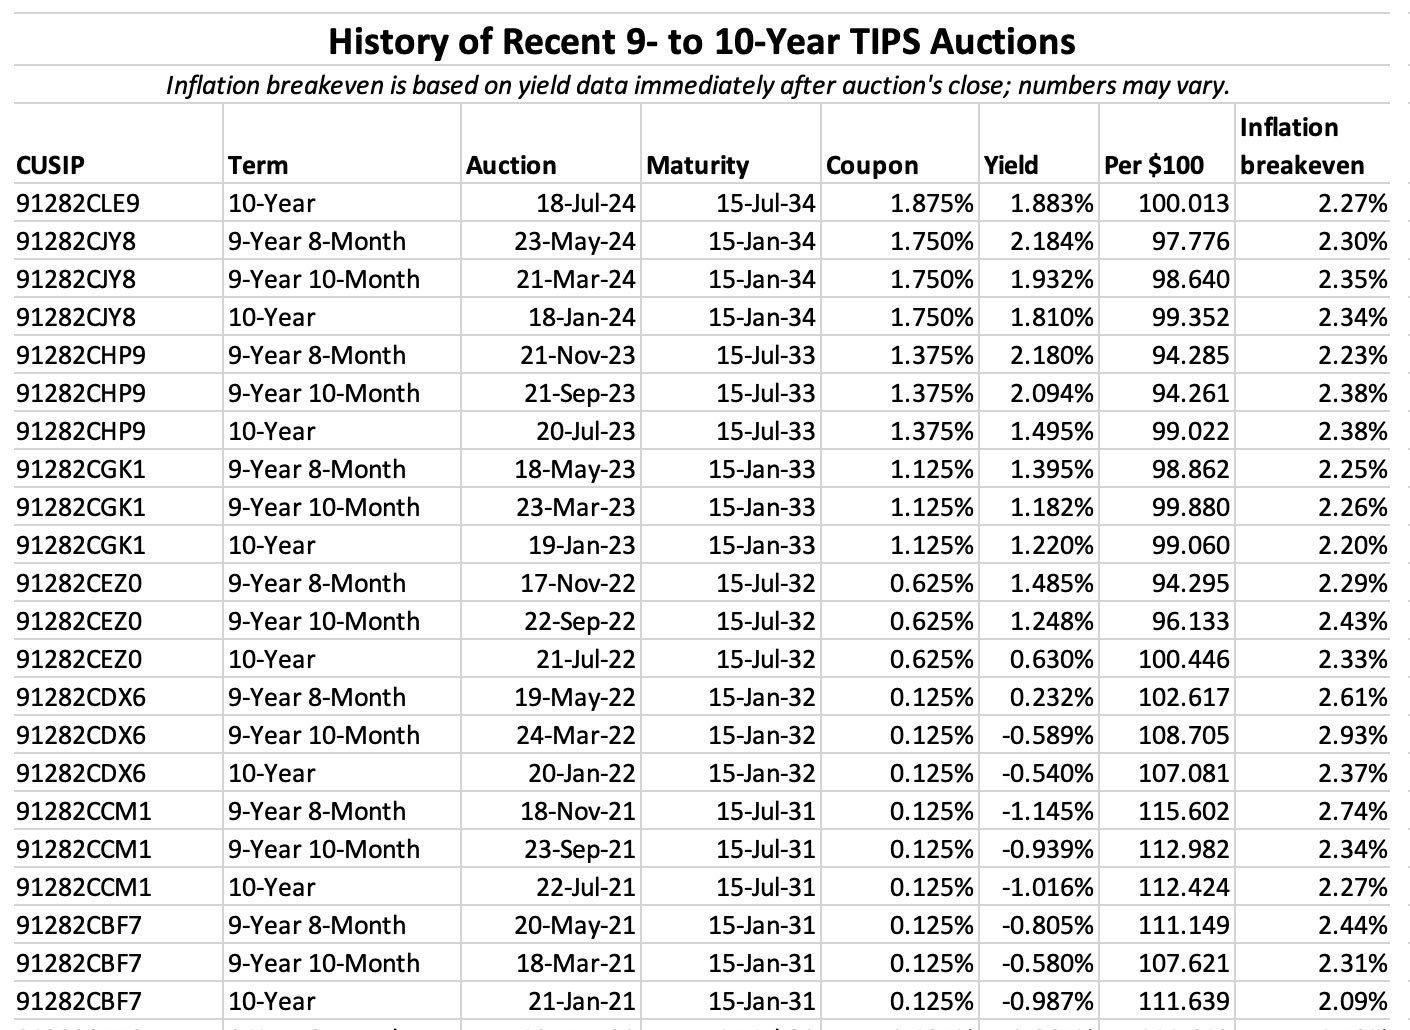
After years of monitoring this fixed-rate decision, (and getting help from clever Bogleheads) I have settled on a formula for forecasting what the Treasury is likely to do. The idea is to look at average real yields of 5- and 10-year TIPS in the six months leading up to the rate decision, and then apply a ratio of 0.65 to those averages.

The formula recently has been accurate when applied to the average for 5-year TIPS, but I like to look at the 10-year TIPS as a backup.

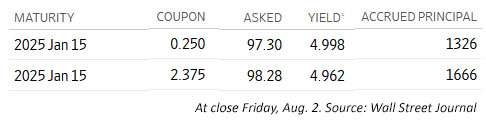
Just before the Treasury’s last I Bond reset on May 1, real yields were at annual highs for 2024, hitting 2.29% for both the 5- and 10-year TIPS on April 30. For the next two months, real yields remained fairly elevated, holding above 2.0% through the beginning of July. But then the decline began, which has accelerated in recent days as the Federal Reserve moves closer to cutting short-term interest rates.

On Tuesday morning, both the 5-year and 10-year TIPS were trading with real yields of about 1.74%, down 55 basis points from the April 30 high.

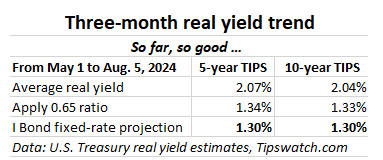
Interesting thing … if you look at just the three months from May 1 to Aug. 5, the I Bond’s fixed-rate projection holds at the current level of 1.3%.

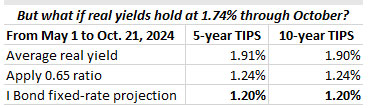
But … what if real yields continue at this 1.74% level (or lower) for the next three months? If that happens, the I Bond’s fixed rate is likely to fall to 1.2%, or lower.

Conclusion. My feeling is that we are likely to see lower real yields in the next few months, so I am going to assume that the I Bond’s fixed rate will be reset in November to a rate lower than the current 1.3%.

The variable rate

Inflation has been slowing in recent months, falling from an annual rate of 3.4% in April to 3.0% in June. (Inflation over the last six months ending in June was 2.4%, which is high for six months. But in the last three months it was up only 0.59%.) The slowdown can be seen in the three months of data we have so far for calculating the I Bond’s new variable rate:

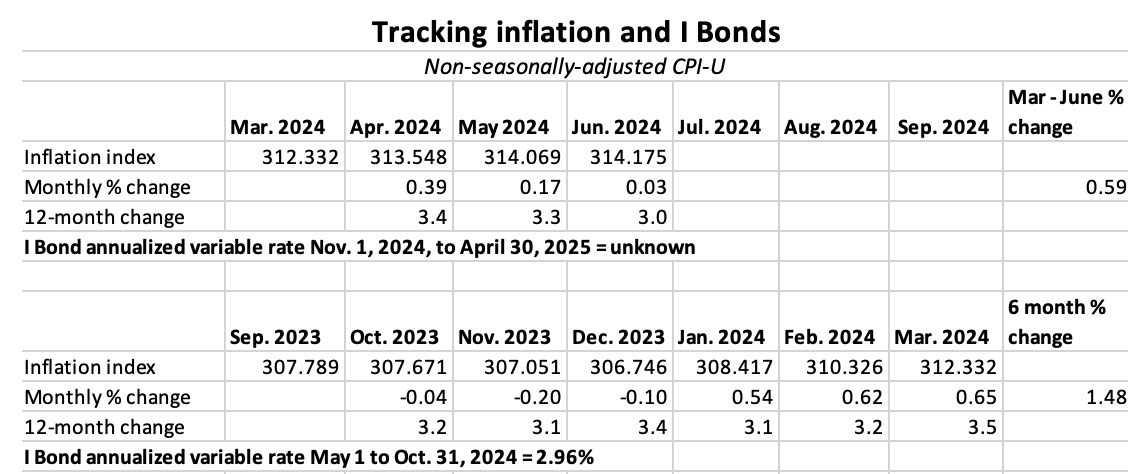
So far, inflation from April to June would translate to a new variable rate of 1.18%, with three months remaining. Because of recent trends, I would guess inflation will average no higher than 0.20% a month for the last three months, and an even lower number seems likely.

Part of my reasoning is that inflation in August 2023 surged higher by 0.44% and then 0.25% in September 2023. I doubt we will see numbers that high this year, so keeping up with 2023 will be tough. Notice that inflation in June 2024 was up only 0.03%, compared to 0.32% in 2023. We could even see a month of deflation in July to September 2024.

Any way you look at it, the I Bond’s variable rate appears likely to fall from the current 2.96% at the November reset. Of course, inflation is full of surprises, so we can’t be sure.

Conclusion

At this point I’d guess that both the I Bond’s fixed rate and variable rate will be lower, creating a composite rate well below the current 4.28%, possibly somewhere around 3.0% to 3.6%.

What does this mean for I Bond investors?

The good news is that three months of high-ish real yields should hold the I Bond’s new fixed rate above 1.0%, even if real yields decline further. In my view, a fixed rate around 1.0% is attractive.

The bad news is that the potentially lower composite rate is going to scare off I Bond investors. It shouldn’t — because in the long term the high fixed rate is the goal.

By mid-2025 we could also see nominal T-bill rates falling to a range below 4.0%. If the I Bond’s fixed rate can hold at 1.0% or above, I would be a buyer in 2025, even with the lower composite rate. But I would also be likely to turn over some remaining I Bonds with very low fixed rates. Those could end up with a six-month composite rate around 2.0% to 2.4%.

Of course, I could be totally wrong. Nothing is certain. The good thing is that this is a very early, mid-term look at potential I Bond interest rates. So the real answer is to sit back and wait to see how things develop.

What do you think? Post your ideas in the comments section.

Confused by I Bonds? Read my Q&A on I Bonds

Let’s ‘try’ to clarify how an I Bond’s interest is calculated

Inflation and I Bonds: Track the variable rate changes

I Bonds: Here’s a simple way to track current value

I Bond Manifesto: How this investment can work as an emergency fund

* * *

Follow Tipswatch on X (Twitter) for updates on daily Treasury auctions and real yield trends (when I am not traveling).

Feel free to post comments or questions below. If it is your first-ever comment, it will have to wait for moderation. After that, your comments will automatically appear.Please stay on topic and avoid political tirades.

David Enna is a financial journalist, not a financial adviser. He is not selling or profiting from any investment discussed. I Bonds and TIPS are not “get rich” investments; they are best used for capital preservation and inflation protection. They can be purchased through the Treasury or other providers without fees, commissions or carrying charges. Please do your own research before investing.

Posted in Cash alternatives, I Bond, Inflation, Investing in TIPS, Savings Bond, Treasury Bills, TreasuryDirect | Tagged , , , | 33 Comments

Let’s look at the two TIPS maturing in January 2025

Are they a steal? Not really.

By David Enna, Tipswatch.com

Recently, I have been getting questions and comments about the two Treasury Inflation-Protected Securities maturing on January 15, 2025. These are quoted on the secondary market as having eye-popping real yields close to 5%.

For example, here is a comment from July 31:

A nominal note (91282CDS7) maturing on January 15 has a YTM of 5.041. The TIPS (912828H45) has a YTM of 5.038. Does that mean if inflation is 0.003% or higher the TIPS will be the better investment? It looks like a steal to me. Am I missing something? Isn’t CPI over 2%? Is the seasonal adjustment going to be -2%?

This issue comes up every year for the TIPS maturing in January because of two oddities of TIPS: 1) After July 15, a TIPS maturing in January has only one coupon payment remaining, and 2) The principal balances for these TIPS are highly likely to get hit by a deflationary month (or two) before maturing. That is likely because TIPS accruals are based on non-seasonally adjusted inflation, which always runs lower than seasonal CPI toward the end of the year.

In 2023, for example, non-seasonal inflation was -0.04% in October and -0.20% in November. Since 2012, October non-seasonal inflation has been negative in 6 of the 12 years. November inflation has been negative 10 of the 12 years.

By market logic, the ending nominal yield for a TIPS purchased today and maturing in January should be close to a T-bill purchased today and maturing in January. Except that with the TIPS, there is a risk of under-performance that is not a factor for the basically riskless T-bill.

For example, last year I made an experimental purchase of CUSIP 912828B25 – maturing in January 2024 – to see how its real yield of about 4.0% would compare with a nominal T-bill of the same term. In that case, the TIPS ended up being the winner versus the T-bill, with an annualized nominal return of 6.2% vs. 5.5% But that won’t always be the case. Some things to consider:

The coupon rate is diminished as a factor.

Both CUSIP 912828H45 and 912810FR4 have only one coupon payment remaining, to be paid on Jan. 15 on the ending principal balance. For H45, the last payment will be 0.125%. For FR4, it will be 1.1875%. It is important to realize that once you purchase a TIPS, your return at maturity will be par value x final inflation index + final coupon payment.

Notice that even though the two TIPS have a wide variance in coupon rate, the current ask price is now quite close — 97.94 vs 98.93. That gap will continue to narrow as we approach Jan. 15, 2025.

The discounted price is key to your return.

If you buy a TIPS with a price of 97.94, you are getting a discount of 2.06%. At maturity, the price will be 100 — par value. If you annualize 2.06% from 5.5 months to a year, you get a nominal return of about 4.55%. The discount, not the coupon rate or upcoming inflation, is the major factor determining your eventual return.

In essence, purchasing a very short-term TIPS is much like purchasing a zer0-coupon bond (or a T-bill, which is originated at a discounted price.)

These TIPS have high inflation accruals.

H45 currently has an inflation index of 1.32602, meaning an investor will be purchasing 32.6% additional principal above par value. FR4 was originally issued on July 15, 2004, as a 20 1/2-year TIPS, so its inflation index is much higher — currently 1.66620. So in this case an investor will be purchase 66.6% additional principal above par value.

Purchasing a very short-term TIPS with a high inflation accrual creates some risk, because only par value is guaranteed to be returned at maturity. That is especially true for a TIPS maturing in January or April, because these TIPS are likely to get hit by a deflationary month near the end of their terms.

A potential scenario

Both of these TIPS already have an inflation index set through August 31, based on June’s meager non-seasonally adjusted inflation of 0.03%. And then …

  • July inflation will set September inflation accruals.
  • August inflation will set October inflation accruals.
  • September inflation will set November inflation accruals.
  • October inflation will set December inflation accruals.
  • November inflation will set inflation accruals through January 15.

I have no idea of where inflation is heading through November 2024, but I do feel confident there could be one or two deflationary months in that mix. And that, I believe, is also what the market is expecting.

In this scenario, I am reflecting market expectations, which appear to be for fairly low non-seasonally adjusted inflation through the end of 2024. Here is how a $10,000 par purchase for these two TIPS works out, using these conservative estimates:

This is an estimate of potential return, not meant to be exact.

One qualification on the annualized yields: Almost all of the yield advantage for the two TIPS comes from the fact they have a 5.5-month term versus 6 months for the T-bill. In other words, the dollar returns would be similar, but the TIPS get there quicker.

In the end — under this inflation scenario — both TIPS would out-perform a 6-month T-bill. If inflation runs higher, each TIPS will do better. If harsher deflation sets in, the TIPS will under-perform. The TIPS investment involves some risk, while the T-bill is essentially riskless. For that reason, it is logical that the TIPS would provide the higher potential yield.

Conclusion. Unless you expect inflation to surge higher at the end of this year, the T-bill still looks like the more sensible, much-less-complex investment. That’s my opinion.

—————————-

Now is an ideal time to build a TIPS ladder

Confused by TIPS? Read my Q&A on TIPS

TIPS in depth: Understand the language

TIPS on the secondary market: Things to consider

TIPS investor: Don’t over-think the threat of deflation

Upcoming schedule of TIPS auctions

* * *

Follow Tipswatch on X (Twitter) for updates on daily Treasury auctions and real yield trends (when I am not traveling).

Feel free to post comments or questions below. If it is your first-ever comment, it will have to wait for moderation. After that, your comments will automatically appear.Please stay on topic and avoid political tirades.

David Enna is a financial journalist, not a financial adviser. He is not selling or profiting from any investment discussed. I Bonds and TIPS are not “get rich” investments; they are best used for capital preservation and inflation protection. They can be purchased through the Treasury or other providers without fees, commissions or carrying charges. Please do your own research before investing.

Posted in Inflation, Investing in TIPS, Treasury Bills | Tagged , , , , | 7 Comments

Projection: Social Security COLA for 2025 should be around 2.7%

By David Enna, Tipswatch.com

The recent release of the June 2024 inflation report created a baseline number for next year’s cost of living adjustment for Social Security recipients. It’s all based on a needlessly complex formula the Social Security Administration uses to set the COLA each year.

  • The index. The SSA does not use the standard measure of inflation that you see reported each month. Instead it uses CPI-W, the Consumer Price Index for Urban Wage Earners and Clerical Workers, which often runs slightly lower than the standard CPI-U.
  • The time period. Instead of using an annual rate of inflation, the SSA looks at only the average of three months, July to September, and compares that to the average from a year earlier. Last year, for example, the three-month average was 301.236, an increase of 3.2% over the average for 2023. So the 2024 COLA was set at 3.2%, even though annual U.S. inflation was running at 3.7%.
  • The summer months. Inflation can be notoriously volatile in the months of July to September. We could easily see a month of high-ish inflation, or an another month of deflation, as we saw in June. That means any Social Security COLA projection — including mine — is just an educated guess.

For June, the BLS set the CPI-W index at 308.054, an increase of 2.9% over the last year. So does that mean the Social Security COLA will end up being 2.9%? No, because only the next three months — July to September — matter in this equation.

In this chart, I have provided four potential monthly inflation scenarios for the July to September period — 0.0% per month to 0.3% per month — and then calculated the effect on the eventual Social Security COLA.

Most likely, none of these scenarios will end up being accurate. Anything can happen, including a bout of deflation. But I think the scenario with the highest probability is inflation averaging 0.2% a month over the three months, resulting in a Social Security COLA of 2.7%.

So my projection is 2.7%. That is a drop from 2024’s increase of 3.2% and is below the current rate of U.S. inflation, at 3.0% for the year ending in June.

As of May 2024, the average Social Security benefit check was $1,778.24, according to the SSA. An increase of 2.7% would raise the average to $1,826.25.

What others are saying

I wrote everything above before looking at any other projections for the Social Security COLA. In my experience, many of these forecasts are wildly off base.

One group I trust is the Senior Citizens League, which crunches a lot of data in developing its forecast. The group is projecting a COLA increase of 2.63% for 2025, which would effectively round to 2.6%.

I’ve seen other projections as high as 3.0%, which could happen but seem unlikely.

SSA COLA versus CPI

In general, the combination of using CPI-W and the smoothing effect of a three-month average results in the Social Security COLA being lower than annual CPI. The Senior Citizens League has lobbied for years to replace CPI-W with CPI-E, and index that more accurately reflects costs faced by older Americans.

For 2024 the COLA was 3.2% even though CPI-U increased 3.7% over the September 2022 to September 2023 period. In some years, however, the COLA has outpaced official inflation. That doesn’t look likely for 2025.

Also read: Does The Social Security COLA Shortchange Seniors?

* * *

Follow Tipswatch on X (Twitter) for updates on daily Treasury auctions and real yield trends (when I am not traveling).

Feel free to post comments or questions below. If it is your first-ever comment, it will have to wait for moderation. After that, your comments will automatically appear.Please stay on topic and avoid political tirades.

David Enna is a financial journalist, not a financial adviser. He is not selling or profiting from any investment discussed. I Bonds and TIPS are not “get rich” investments; they are best used for capital preservation and inflation protection. They can be purchased through the Treasury or other providers without fees, commissions or carrying charges. Please do your own research before investing.

Posted in Inflation, Medicare, Retirement, Social Security | 25 Comments

A 10-year TIPS matured July 15. How did it do as an investment?

By David Enna, Tipswatch.com

On July 15, an ugly-duckling 10-year Treasury Inflation-Protected Security matured. It was CUSIP 912828WU0, first auctioned on July 24, 2014.

I call it an ugly-duckling because the auctioned real yield was 0.249%, setting its coupon rate at just 0.125%, the lowest the Treasury will go for any TIPS. In addition, on auction day it got a inflation breakeven rate of 2.26%, rather high at a time when U.S. inflation was hovering around 2.0%.

In my preview article on this auction, I wasn’t a huge fan:

It’s possible that this new TIPS will auction with the lowest yield to maturity for any 9-to 10-year TIPS since May 2013, when the yield was -0.225%. Since then – for six consecutive auctions – the lowest yield to maturity has been 0.339%.

Nevertheless, CUSIP 912828WU0 turned out to be a fine investment, at least compared with a nominal 10-year Treasury note, which was yielding 2.51% on the day of the auction. Inflation over the next 10 years ended up averaging 2.8%, making this TIPS a better investment by a wide margin with an annual advantage of 0.538% in yield over the 10 years.

Data from Eyebonds.Info show this TIPS produced an annualized nominal yield of 3.048% over the 10 years, much higher than the 10-year note’s 2.51%.

I didn’t buy this TIPS at that auction, but I jumped aboard on the Sept. 18, 2014, reopening auction, when the real yield rose to a more attractive 0.610%. On that day, the 10-year Treasury note had a nominal yield of 2.63%, creating a breakeven rate of 2.02%. The September purchase was also a winner, with a nominal return of 3.445%:

Data from Eyebonds.info

TIPS versus an I Bond

If you purchased an I Bond in July 2014, it had a fixed rate of 0.10%, below the real yield of 0.249% for the TIPS at the original auction. That I Bond has produced a nominal return of about 2.94% according to Eyebonds.info. So the TIPS is the winner, but not by a great margin. The I Bond benefits from better compounding, since all interest payments are added to principal until redemption.

Thoughts

TIPS have been on a winning streak for several years, caused by the surge to 40-year high inflation that peaked in June 2022 at 9.1%. Even today, annual inflation is running higher than the auctioned breakeven rates of 2014. And so TIPS have been the winners versus nominal Treasurys, at least recently.

Notes and qualifications

My chart is an estimate of performance comparing inflation breakeven rates versus actual inflation.

Keep in mind that interest on a nominal Treasury and the TIPS coupon rate is paid out as current-year income and not reinvested. So in the case of a nominal Treasury, the interest earned could be reinvested elsewhere, which would potentially boost the gain. For certain, we don’t know what the investor could have earned precisely on an investment after re-investments.

In the case of a TIPS, the inflation adjustment compounds over time, and that will give TIPS a slight boost in return that isn’t reflected in the “average inflation” numbers presented in the chart.

Now is an ideal time to build a TIPS ladder

Confused by TIPS? Read my Q&A on TIPS

TIPS in depth: Understand the language

TIPS on the secondary market: Things to consider

TIPS investor: Don’t over-think the threat of deflation

Upcoming schedule of TIPS auctions

* * *

Follow Tipswatch on X (Twitter) for updates on daily Treasury auctions and real yield trends (when I am not traveling).

Feel free to post comments or questions below. If it is your first-ever comment, it will have to wait for moderation. After that, your comments will automatically appear.Please stay on topic and avoid political tirades.

David Enna is a financial journalist, not a financial adviser. He is not selling or profiting from any investment discussed. I Bonds and TIPS are not “get rich” investments; they are best used for capital preservation and inflation protection. They can be purchased through the Treasury or other providers without fees, commissions or carrying charges. Please do your own research before investing.

Posted in I Bond, Inflation, Investing in TIPS, Savings Bond | Tagged , , , | 11 Comments

New 10-year TIPS gets real yield of 1.883%

By David Enna, Tipswatch.com

Biella, a town of about 40,000 people, is situated in the foothills of the Alps. Among other things, this area is famous for the production of vermouth.

I am writing this after an evening out in Biella, Italy, and while struggling with rather weak Internet. So this is going to be brief.

The U.S. Treasury’s auction of $19 billion of a new 10-year Treasury Inflation-Protected Security, CUSIP 91282CLE9, generated a real yield to maturity of 1.883%. The coupon rate was set at 1.875%, the highest for this term since July 2009. That was 88 auctions ago for this term of TIPS.

While the coupon rate set a milestone, the real yield to maturity was below the last two auctions of this term, which hit a multi-year high of 2.184% in a reopening auction on May 23, 2024. That was CUSIP 91282CJY8, which was trading Thursday morning with a real yield to maturity of about 1.91%, a bit higher than this auction result.

The “when issued” prediction for this new TIPS, set just before the auction’s close, was for a real yield of 1.865%. The auction came in a bit higher at 1.883%, which indicates slightly weak demand. The bid-to-cover ratio was 2.38, slightly higher than recent auctions of this term.

So … all things considered … this looks like a routine auction. No surprises.

Pricing

This TIPS will have an inflation index of 1.00086 on the settlement date of July 31. It auctioned at an unadjusted price of 99.926982. Those two factors combine to create an adjusted price of 100.012919.

So an investor purchasing $10,000 par value of this TIPS will be receiving $10,008.60 in principal on the settlement date, at a cost of about $10,001.29, plus about $8.16 of accrued interest, which will be returned at the first coupon payment in January.

This TIPS auctioned at a total cost very close to par value, which is the amount guaranteed to be returned at maturity, even after a severe period of deflation. (That is comforting, but a very, very minor issue.)

Inflation breakeven rate

With a 10-year Treasury yielding 4.18% at the auction’s close, CUSIP 91282CLE9 gets an inflation breakeven rate of 2.27%, lower than the last four auctions of this term. This means the new TIPS will out-perform a similar Treasury note if inflation averages more than 2.27% over the next 10 years.

Here is a history of TIPS auctions of this term over the last three years:

—————————-

Now is an ideal time to build a TIPS ladder

Confused by TIPS? Read my Q&A on TIPS

TIPS in depth: Understand the language

TIPS on the secondary market: Things to consider

TIPS investor: Don’t over-think the threat of deflation

Upcoming schedule of TIPS auctions

* * *

Follow Tipswatch on X (Twitter) for updates on daily Treasury auctions and real yield trends (when I am not traveling).

Feel free to post comments or questions below. If it is your first-ever comment, it will have to wait for moderation. After that, your comments will automatically appear.Please stay on topic and avoid political tirades.

David Enna is a financial journalist, not a financial adviser. He is not selling or profiting from any investment discussed. I Bonds and TIPS are not “get rich” investments; they are best used for capital preservation and inflation protection. They can be purchased through the Treasury or other providers without fees, commissions or carrying charges. Please do your own research before investing.

Posted in Inflation, Investing in TIPS | Tagged , , , , , | 16 Comments