U.S. inflation rose 0.1% in August: What it means for TIPS, I Bonds and Social Security COLA

This report is going to roil financial markets.

By David Enna, Tipswatch.com

Surprises, surprises. Financial markets, which had been rallying over the last week on expectations of falling prices, got an inflation reality check today: Seasonally adjusted U.S. inflation rose 0.1% in August, and 8.3% over the last year, the Bureau of Labor Statistics reported.

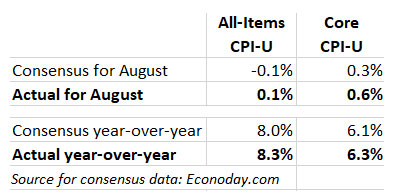
Economists had been expecting inflation to decline for the month, based on plummeting gasoline prices, which were down 10.6% for the month. Instead, both the monthly and year-over-year numbers came in higher than expectations. Core inflation, which removes food and energy, also greatly surpassed expectations, coming in at 0.6% for the month (versus an expected 0.3%) and 6.3% for the year (versus 6.1%).

My two-word analysis: “Not good.”

The BLS noted that increases in the shelter, food, and medical care indexes were the largest of “many” contributors to the all-items increase, overwhelming the deep decline in gasoline prices. Some key data from the report:

  • Food prices rose 0.8% for the month (the smallest monthly increase this year) and are now up a painful 11.4% year over year. Prices for all six major grocery store indexes increased.
  • The food at home index has increased 13.5% over the last 12 months, the largest one-year increase since March 1979.
  • Shelter costs increased 0.7% for the month and are up 6.2% year over year. The rent index rose 0.7% for the month.
  • Costs of medical care services were up 0.8% for the month and 5.6% for the year.
  • The index for household furnishings increased 1.0% in August after rising 0.6% in July.
  • Apparel costs were up a moderate 0.2% and 5.1% for the year.
  • The index for airline fares decreased 4.6% after falling 7.8% in July.

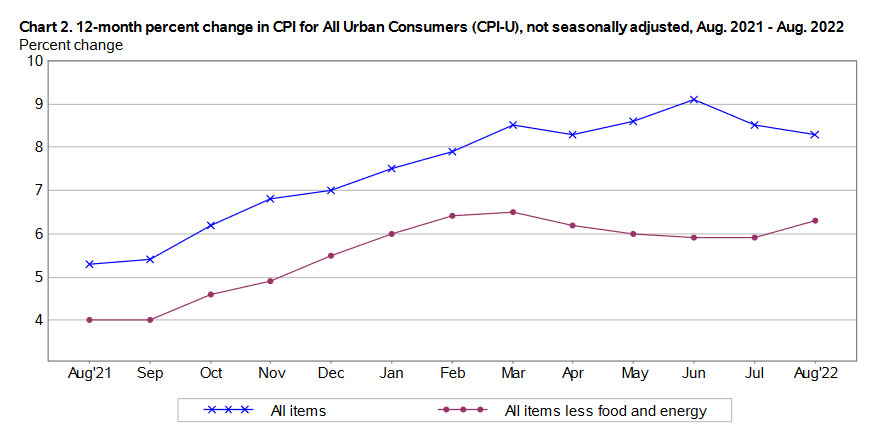
Here is the trend in annual all-items and core inflation over the last year, showing the slight rise in core inflation even as falling gasoline prices have caused all-items inflation to fall from the June peak of 9.1%.

What this means for TIPS and I Bonds

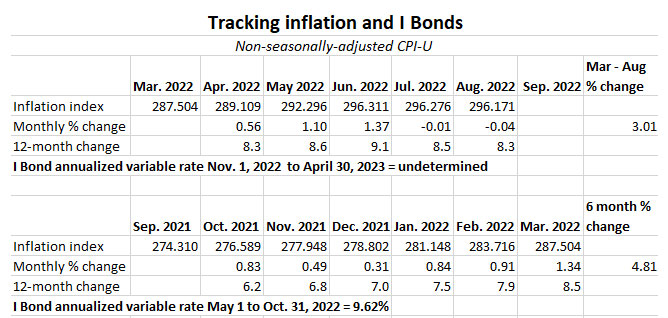
Investors in Treasury Inflation-Protected Securities and U.S. Series I Savings Bonds are also interested in non-seasonally adjusted inflation, which is used to adjust principal balances for TIPS and set future interest rates for I Bonds. For August, the BLS set the inflation index at 296.171, a decline of 0.04% from July’s 296.276. The BLS called this “unchanged.”

For TIPS. The August report means that principal balances for all TIPS will decrease 0.04% in October, after falling 0.01% in September. However, year-over-year balances will have increased 8.3% by the end of October. Here are the new October Inflation Indexes for all TIPS.

For I Bonds. The August report is the fifth in a six-month series that will set the I Bond’s new variable rate, which will begin rolling out November 1 for all I Bonds. As of August, inflation has run at a rate of 3.01%, which would translate to an I Bond variable rate of 6.02%, lower than the current rate of 9.62%. However, one month remains. Oil prices seem to have stabilized this month, so it’s possible we will see a higher number. Here are relevant data:

Note: This is a corrected version. My first attempt had the inflation rate at 3.02%.
You can see historic data back to 2012 on my Inflation and I Bonds page.

What this means for Social Security COLA

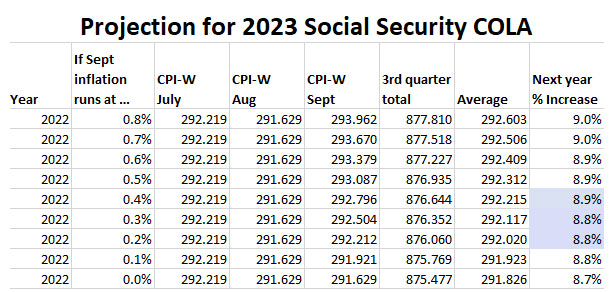
The August inflation report is the second of three — for July to September — that will set the Social Security Administration’s cost of living adjustment for 2023. The SSA uses a three-month average of a different index, the Consumer Price Index for Urban Wage Earners and Clerical Workers (CPI-W), to set its COLA.

For August, the BLS set CPI-W at 291.629, an increase of 8.7% over the last 12 months. However, CPI-W actually fell 0.2% for the month. But remember, it will be the average of July to September inflation indexes — compared to the same three-month average a year ago — that will determine the Social Security COLA. A year ago, that average was 268.421. If we have zero inflation in September, the COLA will be 8.7%.

Keep in mind that one month remains, and the COLA calculation could push slightly higher.

Here is my updated projection:

What this means for future interest rates

The S&P 500 just opened for trading today and it is down about 2.3%, after flashing higher minutes before the August inflation report was released. The reason: The markets are losing hope — a false hope in my opinion — that the Federal Reserve would begin easing off on tightening as U.S. inflation drifts lower. Although the monthly all-items number looks mundane, this was an ugly inflation report, with prices increasing across the economy despite a quick and steep decline in gasoline prices. Core inflation jumped from an annual rate of 5.9% in July to 6.3% in August.

U.S. inflation remains close to a four-decade high. This is not the time for the Federal Reserve to back off on its clear, necessary goal: to bring inflation down to a level at least approaching its target of 2%. Today’s report all but guarantees a 75-basis-point increase in the federal funds rate next week.

From today’s Wall Street Journal report:

Broad price pressures have proven resilient, causing the Federal Reserve to keep raising interest rates to fight inflation, said Kathy Bostjancic, chief U.S. economist at Oxford Economics.

“Inflationary dynamics are improving and moving in the right direction,” she said. “But they’re still running way too hot for comfort, either for individuals and businesses or the Federal Reserve.”

From Bloomberg:

The acceleration in inflation points to a stubbornly high cost of living for Americans, despite some relief at the gas pump. Price pressures are still historically elevated and widespread, pointing to a long road ahead toward the Fed’s inflation target. …

“If there was any doubt at all about 75 — they’re definitely going 75” at next week’s Federal Open Market Committee meeting, Jay Bryson, chief economist at Wells Fargo & Co., said on Bloomberg Television. “We thought they’d be stepping it back to 50 in November. At this point, you’d say 75 is certainly on the table in November.”

* * *

Feel free to post comments or questions below. If it is your first-ever comment, it will have to wait for moderation. After that, your comments will automatically appear.

David Enna is a financial journalist, not a financial adviser. He is not selling or profiting from any investment discussed. The investments he discusses can be purchased through the Treasury or other providers without fees, commissions or carrying charges. Please do your own research before investing.

Posted in Federal Reserve, I Bond, Inflation, Investing in TIPS, Savings Bond, Social Security | 29 Comments

Let’s ‘try’ to clarify how an I Bond’s interest is calculated

You didn’t expect this to be simple, did you?

Author’s note: This article ended up being “crowdsourced” through helpful (and accurate) criticism in the comments section. The Excel formulae have been edited to reflect these better techniques. Read the comments section for more great ideas.

By David Enna, Tipswatch.com

Although I have been investing in I Bonds for more than 20 years and have been writing about them for 11 years, I never paid much attention to the “exact” way interest is calculated. I figured, I’ve got a $10,000 I Bond earning 9.62%, so in six months I’d earn $481. Close enough, right?

But if you use TreasuryDirect’s Savings Bond Calculator you may notice very slight discrepancies, even after accounting for the three-month early withdrawal penalty. The Treasury’s interest calculation is ridiculously complex and possibly a relic of ancient times when $25 savings bonds were a thing.

I don’t think TreasuryDirect ever explicitly explains the complex process, but here is a good explanation of the I Bond interest calculation from the Bogleheads Wiki:

How interest is calculated

All bond values are based on the $25 bond. A $5000 bond is worth 200 times what a $25 bond is worth; a $100 bond is worth 4 times what a $25 bond is worth. If you have a $80 electronic bond at TreasuryDirect, it is worth 3.2 $25 bonds. The $25 bond value is always rounded to the nearest penny. Thus, a $5000 bond must always have a value that is a multiple of $2.00.

Interest is computed on a $25 bond using the composite rate divided by 2 for the given six month period. For individual months within the six month period, interest is computed using pseudo-monthly compounding to produce the same result after six months. For example, if the composite rate is 2.57%, the bond value after 1 month  is $25 × (1 + 0.0257/2)^(1/6) = $25.05, and after 4 months is $25 × (1 + 0.0257/2)^(4/6) = $25.21, and after 6 months is $25 × (1 + 0.0257/2)^(6/6) = $25.32.

The values of a $100 bond would be $100.20, $100.84, and $101.28 after those same time periods. Note that this ignores the 3 month penalty for redemption within the first 5 years and the restriction on redemption within the first year.

You have to love the term “pseudo-monthly compounding” and you’d have to be a genius to apply these formulae to your holdings. I mean, what the heck is a ^? But the key factor is that the interest is applied to $25, rounded to the nearest penny, then scaled up to match your current I Bond holding.

If you bought $10,000 in an I Bond dated May 2022, this would be the formula you’d use in Excel to determine the value for the first month, effective on the first day of the month after your purchase: =ROUND(25*(1+0.0962/2)^(1/6),2) . The second month would be =ROUND(25*(1+0.0962/2)^(2/6),2) . The result for month one is $25.20 and multiply that by 400 to get the investment value of $10,080. For month two it is $25.39 for a value of $10,156. I worked my way through Excel to produce this for an I Bond purchased in May 2022:

Note: What is the ROUND factor? This came from feedback from readers. If you want to incorporate rounding to the penny into the “Cumulative $25 bond value” column, you need to add ROUND to the formula, as shown in the above examples. It is important to do this if you plan on incorporating that column’s calculation into an additional formula, because this is how the Treasury does its calculations.

Read the comments section for other helpful suggestions from Excel nerds.

I used TreasuryDirect’s Savings Bond Calculator to double-check these value amounts and the October amount (actually the value on November 1) did match the total of $10,236, which is the way TreasuryDirect reports values, minus the three-month interest penalty for early redemptions. Here it is, with a $1,000 investment shown because TreasuryDirect’s calculator is for “paper I Bonds only” and won’t allow an investment input of more than $5,000.

$1,023.60 x 10 = $10,236, which matches my calculation.

But the tougher question and still a “great unknown” is what happens after six months, when the I Bond’s balance compounds? I couldn’t find a single source that could explain the exact formula. So I devised on of my own. It works, but it could be wrong. Ponder that, math teachers.

Here is the calculation for an I Bond purchased in November 2021, earning 7.12% for six months and then 9.62% for six months.

In this calculation, I updated the baseline $25 to a value of $25.89 and the new formula for May became =ROUND(25.89*(1+0.0962/2)^(1/6),2) . The formula for June is =ROUND(25.89*(1+0.0962/2)^(2/6),2) . And so on. Using this formula, I was able to match TreasuryDirect’s last estimate of value, which is for October on my chart but actually for November 1. (I Bond interest is earned on the first day of the month for the previous month.)

$10,60.40 x 10 = $10,604, which matches my calculation.

As a triple-check, I confirmed my calculations for the May 2022 I Bond values and November 2021 I Bond values on the EyeBonds.info site, which is as rock solid as any information you will find. My numbers matched up with that site’s findings.

Don’t forget …

Until your I Bond investment reaches 5 years, TreasuryDirect will always show the current value minus the latest three months of interest. You have earned that interest, but TD won’t show it to you, because if you sold out today, you’d get the amount they indicate.

In the case of the November 2021 purchase, that $10,000 I Bond is actually worth $10,856, even if TD shows you $10,604.

A Tip of the Hat to Jennifer Lammer

Lammer, CEO of Diamond NestEgg, is a YouTube video star who offers some well-explained, well-documented advice on I Bonds and other investments. She created this video to explain the complexities of I Bond interest payments and the very strange $25 baseline for all investments.

Her worksheet calculations don’t match mine — we used different starting months — but we come up with similar results, which as I love to note, would drive math teachers crazy. There is a lot of good information in this video, and Lammer makes a valiant effort to make something very complex sound simple. If anyone has further advice on this I Bond calculation, send it my way in the comments section below.

Confused by I Bonds? Read my Q&A on I Bonds

Inflation and I Bonds: Track the variable rate changes

I Bond Manifesto: How this investment can work as an emergency fund

* * *

Feel free to post comments or questions below. If it is your first-ever comment, it will have to wait for moderation. After that, your comments will automatically appear.

David Enna is a financial journalist, not a financial adviser. He is not selling or profiting from any investment discussed. The investments he discusses can be purchased through the Treasury or other providers without fees, commissions or carrying charges. Please do your own research before investing.

Posted in I Bond, Savings Bond, TreasuryDirect | 163 Comments

Video: An economist offers a common-sense look at U.S. inflation

‘We are, unfortunately, about to go through a period of prolonged, persistent high inflation.’

By David Enna, Tipswatch.com

There’s a lot of speculation in financial markets right now about an upcoming dip in U.S. inflation, triggered by a strong decline in gasoline prices. We saw some of that effect in July with all-items inflation flat for the month, even though core inflation rose 0.3%. We could see a similar result in August inflation, to be released Sept. 13.

So yes, U.S. inflation is falling from its 9.1% annual peak in July, and will probably continue to gradually decline. But by how much, and how fast? How long will it take to get to the Federal Reserve’s target of 2% annual inflation?

Here’s a clearly explained outlook from Campbell Harvey, a Canadian economist who is professor of finance at Duke University and a Research Associate of the National Bureau of Economic Research in Cambridge, Massachusetts. In the video, Harvey explains why statistical and structural evidence points to U.S. inflation remaining at an annual rate of of at least 6.2% by the end of the year, even if deflationary pressures continue for several months. A more realistic number might be above 7.0%, he suggests.

“It’s kind of obvious looking at the data, but a lot of people don’t pick it up, is that we’ve already had year to date … 6.3% inflation. So if you think that inflation is going to end the year at 2 or 3 percent, it means that we are going to have strong negative inflation. … And I think that is very unlikely.”

Harvey also points out important changes in the way inflation was calculated 40 years ago versus today. The key point is that changes in the shelter index (which is weighted to be about 32% of all-items inflation) were designed to smooth out volatility, and that means inflation is printing lower than reality. The result: “There is more to come. And it is because of this smoothing.”

“The point is, this inflation has already happened, but it is not reflected in the CPI. And it will be reflected in the next year, or maybe longer. So anybody who is telling the story ‘oh well, this is just supply chain or geopolitical risk and we’ll quickly be back down to 2, 3 percent’ … No. You have to look at the actual structure of how inflation is calculated.”

It’s an excellent video. Give it a watch.

* * *

Feel free to post comments or questions below. If it is your first-ever comment, it will have to wait for moderation. After that, your comments will automatically appear.

David Enna is a financial journalist, not a financial adviser. He is not selling or profiting from any investment discussed. The investments he discusses can be purchased through the Treasury or other providers without fees, commissions or carrying charges. Please do your own research before investing.

Posted in Federal Reserve, Inflation | 10 Comments

What’s up with those crazy real yields on ultra-short-term TIPS?

By David Enna, Tipswatch.com

Update: This TIPS matured Jan. 15, 2023. How did it work as an investment?

Just about every month, I get emails or comments from readers pointing out what appears to be extremely attractive real yields on very short-term TIPS — especially those maturing in less than a year. My usual response is that these real yields get highly exaggerated as maturity nears and only one coupon payment remains.

I’ll admit I don’t fully understand the mechanics of the quoted real yields when TIPS are down to the final months. But I assume — and I am pretty sure I am right — that the market is pricing these TIPS correctly. This month, we have another example, and I decided to take a walk-through look at this possible investment, CUSIP 912828UH1:

CUSIP 912828UH1 was originally issued as a 10-year TIPS on January 15, 2013. I wrote about this TIPS back then, believe it or not. It was in the early years of misery for TIPS investors, with this TIPS getting a real yield of -0.630% and a coupon rate of 0.125%. Now, as it is approaching maturity, it has built up an inflation accrual index of 1.28372 as of September 1. And on Thursday it was trading with an “apparent” real yield of 4.047%, according to the Wall Street Journal’s closing statistics.

So, an investor in this TIPS will be purchasing 28.3% of additional principal above par, and that principal is not protected against deflation in future months. In fact, the principal balance of this TIPS will decline 0.01% in September, based on non-seasonally adjusted inflation in July. We could see more declines in October and November, if falling gas prices create deflationary numbers for August and September, which seems possible.

I went onto Vanguard’s trading platform and entered a $10,000 purchase of this TIPS (for example purposes only — I didn’t complete the purchase). Here is what the order sheet showed Thursday afternoon:

Note that a purchase of $10,000 of par value will cost an investor $12,660.82. Here’s a rundown on the basics of that investment, and note that my total cost is off from Vanguard’s by 5 cents, and I have no idea why:

Because of the discounted price, an investor is getting $12,837 of principal from a $12,661 investment, which is attractive. But just how attractive? It’s hard to say, because the final payment at maturity on January 15, 2023, is going to depend on how hot or cold inflation runs through November. The Treasury market is speculating that inflation will decline or at least remain muted through the end of the year, which could be accurate. Or could this be recency bias based on the recent collapse in oil prices?

Here is my speculation on a “muted inflation” scenario for this TIPS, with inflation falling -0.05% in August, then remaining flat in September, rising 0.1% in October and then 0.2% November. (This TIPS will get an inflation adjustment of 15 days from November inflation in its final month.)

If things work out this way — pure speculation — the investor on September 1 will have invested $12,660 and will get a return of about $12,863 on January 15.That’s a gain of $203, which isn’t shabby for a 4 1/2 month investment. It’s an annualized return of about 4.38%. Not quite up to I Bond standards, but better than similar nominal Treasury yields, which are hanging just above 3%.

Based on this rough look at CUSIP 912828UH1, it seems like a reasonable investment, given the discounted price. The investor picks up the risk of the 28% inflation accrual, which could get depleted if deflation becomes a “thing” in the next several months. My example may be too optimistic. Who knows? The market is clearly signaling a belief that inflation will be very low, or negative, through November.

Would I buy it? No, I am not interested. It’s just too complex to be worth the trouble. This example was simply meant to demonstrate the “logic” of today’s market, which might be logical, or possibly crazed.

* * *

Feel free to post comments or questions below. If it is your first-ever comment, it will have to wait for moderation. After that, your comments will automatically appear.

David Enna is a financial journalist, not a financial adviser. He is not selling or profiting from any investment discussed. The investments he discusses can be purchased through the Treasury or other providers without fees, commissions or carrying charges. Please do your own research before investing.

Posted in Inflation, Investing in TIPS | 17 Comments

Yes, I am still traveling (and news is breaking out all over the place)

By David Enna, Tipswatch.com

I woke up today in rainy Sitka, Alaska. Rain is not an an unusual thing in Alaska in August, I have learned. It has rained every single day on this trip, which started August 14. Rain is in the forecast for the rest of the trip.

But hey, we’ve seen some rainbows … and bears, moose, eagles, ravens, caribou, reindeer … along the way. No otters yet, I want to see an otter.

I know a lot of news has been breaking out in the last two weeks, which always seems to happen when I am traveling, especially in places with little or no internet. From the little I can grasp, it appears that Fed Chairman Jerome Powell finally set the markets straight on his intentions: To fight inflation until inflation is defeated. That was what Powell should have said, and the markets should have expected it.

But, no, the markets still had a lingering belief that the Fed would step in to save the stock market. But that can’t happen while U.S. inflation is continuing at an annual rate of 8.5% and raging even higher across the globe.

So for inflation-protected investments, what has happened in the last two weeks?

  • The 5-year real yield started at 0.29% on Aug. 15 and closed Friday at 0.47%.
  • The 10-year real yield started at 0.35% and ended at 0.47%.
  • The 30-year real yield started at 0.89% and ended at 0.85%.

These aren’t dramatic moves, but the current yields keep the 5- and 10-year TIPS as attractive investment possibilities. There’s a 10-year TIPS reopening auction coming up on Sept. 22, followed by a new 5-year auction on Oct. 20. Both of these could be attractive, especially since the 5-year real yield should track higher with any upcoming Fed moves in September.

I’m not connected enough right now to give an opinion on anything else going on. If you you have ideas, comments or theories, post them in the comments section below.

I will be back home in North Carolina mid-week, as long as I survive whatever Covid protocols are thrown at me in the last days of the trip. In closing, here’s a view of Denali National Park:

* * *

Feel free to post comments or questions below. If it is your first-ever comment, it will have to wait for moderation. After that, your comments will automatically appear.

David Enna is a financial journalist, not a financial adviser. He is not selling or profiting from any investment discussed. The investments he discusses can be purchased through the Treasury or other providers without fees, commissions or carrying charges. Please do your own research before investing.

Posted in Investing in TIPS | 27 Comments