A stunner: I Bond’s inflation-adjusted variable rate will surge to 3.54% in May

By David Enna, Tipswatch.com

U.S. inflation surged 0.6% in March, the Bureau of Labor Statistics reported today, and provided the final piece of data to determine the new variable rate for U.S. Series I Savings Bonds: a whopping 3.54%, annualized, for purchases after April 30 and eventually for all I Bonds.

The I Bond’s new variable rate is based on a six-month inflation rate, in this case from September 2020 to March 2021. Non-seasonally adjusted inflation increased 1.77% over that period, which translates to a new six-month variable rate of 3.54%, annualized, for all I Bonds. That is a huge increase over the current rate of 1.68%.

May 3 Update: I Bond’s fixed rate holds at 0.0%; composite rate soars to 3.54%

April 15 Update: I Bond dilemma: Buy in April, buy in May, or wait until later?

In today’s report, the BLS set the March inflation index at 264.877, an increase of 0.71% over the February number. It’s been a strange six months, with non-seasonally adjusted inflation rising only 0.06% in the first three months, then surging 1.69% in the last three months.

Here are the relevant numbers (you can see historical data on this page, which I update monthly):

What this means

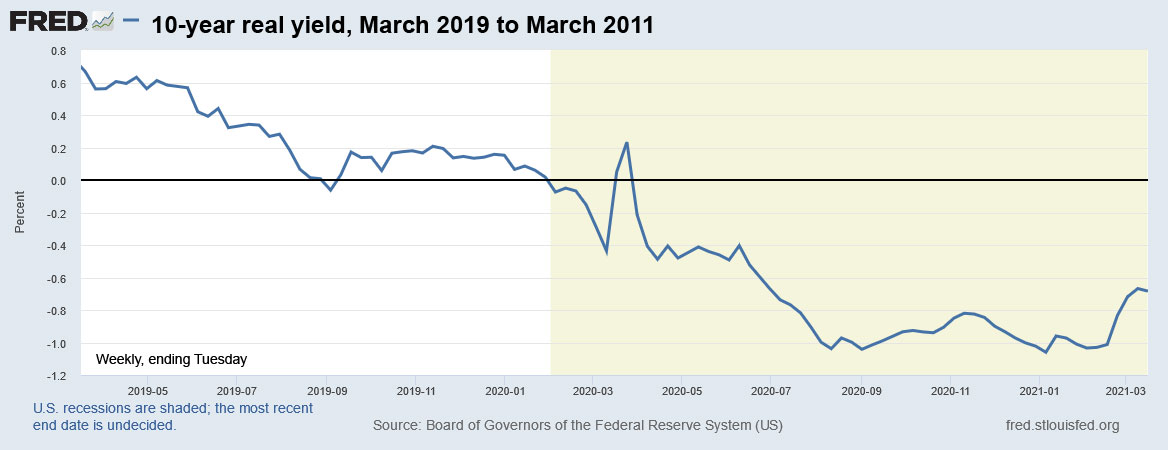
Obviously, we are going to see intense investor interest in I Bonds over the next few months, with the new composite interest rate — combined with a 0.0% fixed rate — likely to be 3.54% (annualized) for six months. That is the highest rate reset since May 2011, when the inflation-adjusted variable rate surged to 4.6%.

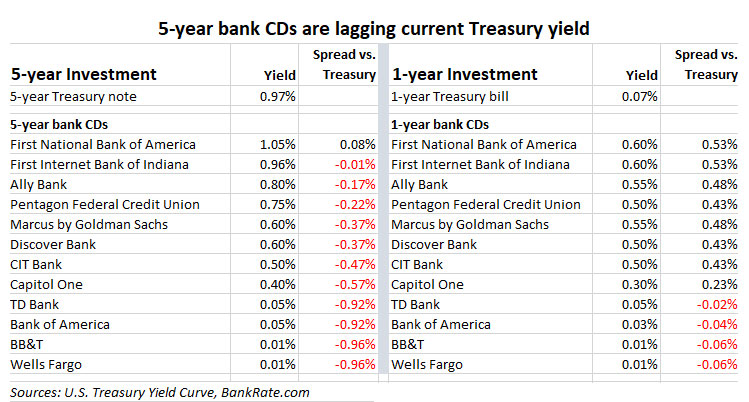
For current I Bonds. If you already bought your I Bond allocation in 2021 (as I did in January), you will be earning 1.68% for six months and then 3.54% for six months, for a one-year rate of 2.61%, triple the current earnings of any other very safe one-year investment.

Investments in I Bonds are limited to $10,000 per person per calendar year, along with the possibility of purchasing $5,000 in paper I Bonds in lieu of a federal income tax refund.

All I Bonds, no matter when they were purchased, will get the 3.54% variable rate for six months. When that rate kicks in depends on the month you purchased the I Bond. Remember, when you purchase an I Bond, you always get the current composite rate for six months, before the next reset takes effect. Here is that schedule:

Issue month of your bondNew rates take effect
JanuaryJanuary 1 / July 1
FebruaryFebruary 1 / August 1
MarchMarch 1 / September 1
AprilApril 1 / October 1
MayMay 1 / November 1
JuneJune 1 / December 1
JulyJuly 1 / January 1
AugustAugust 1 / February 1
SeptemberSeptember 1 / March 1
OctoberOctober 1 / April 1
NovemberNovember 1 / May 1
DecemberDecember 1 / June 1

Purchases after May 1. If you wait until May 1 to purchase I Bonds, you can be assured of earning 3.54% for six months, and then a-yet-to-be determined rate for six months. But the worst you could do is 1.77% over the year, even if the next variable rate resets to 0.0%.

I suspect a lot of investors who haven’t yet purchased I Bonds in 2021 will now wait until after May 1, locking in that higher variable rate for the first six months.

Let’s remember the reason we invested in I Bonds: To protect against unexpectedly high inflation. In March 2021, we got exactly that. I will be writing more on this topic in a few days after I let today’s news settle in.

The March inflation report

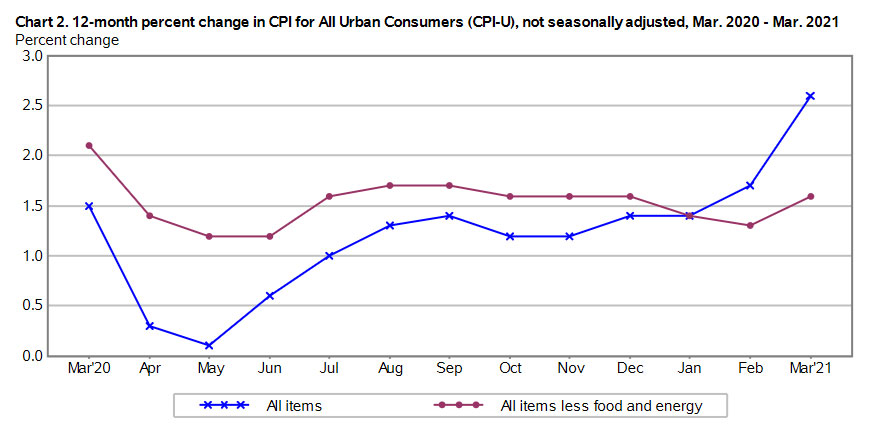
The Consumer Price Index for All Urban Consumers increased 0.6% in March on a seasonally adjusted basis, the BLS reported. This 1-month increase was the largest rise since a 0.6% increase in August 2012. Over the last 12 months, the all-items index increased 2.6%.

Economists were expecting higher inflation in March, based on very weak numbers in pandemic-stricken March 2020. But actual inflation for the all-items index was higher than the consensus, for both the month and year-over year.

Core inflation, which removes food and energy, came in at 0.3% for the month, also higher than the consensus estimate. The year-over-year number for core inflation matched the target of 1.6%.

The BLS noted that higher gasoline prices again were a key factor in March’s inflation increase, rising 9.1% for the month and accounting for nearly half of the seasonally adjusted increase in the all-items index. Other items of interest:

  • Food prices increased a moderate 0.1% in the month, but are up 3.5% over the last year.
  • The costs of shelter increased 0.3%, but are up only 1.7% over the year. (Rents have been held down by eviction moratoriums and other measures, which may end soon.)
  • Prices for used cars and trucks increased 0.5% and are up 9.4% over the year.
  • Apparel prices fell 0.3% and are down 2.5% over the year.
  • The motor vehicle insurance index increased for the third consecutive month, rising 3.3 percent in March.
  • The index for medical care services rose 0.1% for the month and is up 2.7% for the year.

Here is the overall trend for both all-items and core inflation over the last year, showing the dramatic rise in all-items inflation (primarily caused by rising gas prices) and the relatively stable path for core inflation:

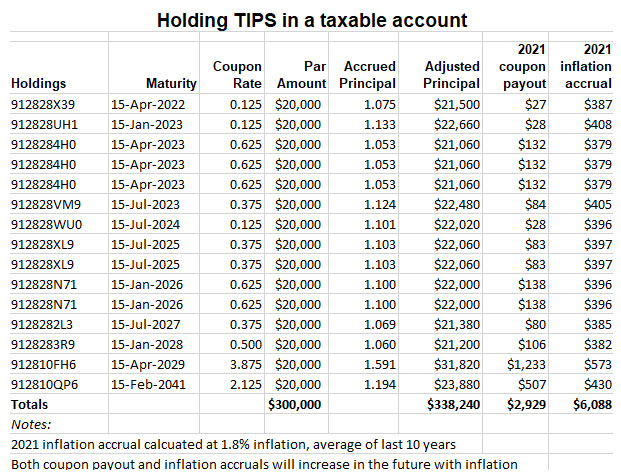
What this means for TIPS

As with I Bonds, non-seasonally adjusted inflation is the key number for Treasury Inflation-Protected Securities, setting future adjustments of principal balances for TIPS. March’s increase of 0.71% in non-seasonally adjusted inflation means that principal balances for all TIPS will rise 0.71% in May, following a 0.55% increase in March.

Here are the new May Inflation Indexes for all TIPS.

What this means for future interest rates

The Federal Reserve certainly saw this coming: U.S. inflation was going to surge in the spring of 2021 when compared to the very weak numbers of spring 2020, when much of the economy was shut down. I don’t think today’s report alone will have any effect on the Fed’s policy. It will need to see many months of surging inflation to change course.

So for now, expect the Fed to continue holding short-term interest rates near zero, and to continue its current program of bond-buying, with any tapering or increases that could jolt the market.

* * *

David Enna is a financial journalist, not a financial adviser. He is not selling or profiting from any investment discussed. The investments he discusses can purchased through the Treasury or other providers without fees, commissions or carrying charges. Please do your own research before investing.

Posted in I Bond, Inflation, Savings Bond | 11 Comments

Inflation is heading higher. Will it be a ‘head fake’?

By David Enna, Tipswatch.com

One of the most important inflation reports of the year is coming up Tuesday at 8:30 a.m., when the Bureau of Labor Statistics releases its March inflation report. That report carries a lot of weight, because:

  • It will set the I Bond’s new inflation-adjusted variable rate, which looks likely to rise to 2.5% or higher (annualized), maybe even 2.8% or higher. That rate — which will go into effect for newly purchased I Bonds on May 1 and eventually for all I Bonds — is based on official U.S. inflation from September 2020 to March 2021. Through February, inflation had increased 1.05%, which translates to an I Bond variable rate of 2.10%. If non-seasonably adjusted inflation comes in at — let’s say a conservative 0.3% — The I Bond’s variable rate would rise to 2.7%, versus the current 1.68%.
  • The consensus estimate for seasonally adjusted all-items inflation in March is 0.5%, following a rise of 0.4% in February. That would likely push year-over-year U.S. inflation up to about 2.5%, the highest rate since January 2020.
  • Core inflation, which strips out food and energy, is projected to increase 0.2% for the month, pushing the year-over-year number up to 1.6%, from last month’s 1.3%. If core inflation comes in higher than 0.2%, it will be signalling a stronger inflationary trend.

None of this is surprising. Remember that inflation in March 2021 is being measured against inflation in pandemic-stricken March 2020, which declined 0.2% that month and declined again 0.7% in April 2020. So it’s been looking likely that we would see a surge in U.S. inflation in spring 2021, reflecting the effects of a year of government stimulus and economic recovery.

This is the theme of a report issued last week by the investment firm PIMCO, “Dealing With an Inflation Head Fake,” written by Joachim Fels and Andrew Balls. Their premise is that although the U.S. and global economies will be recovering strongly this year, the jump in inflation will be temporary. From the report:

Investors should be prepared for an inflation “head fake” and look to maintain portfolio flexibility and liquidity to be able to respond to events in what is likely to be a difficult and volatile investment environment. …

While there is a lot of potential for medium-term economic scarring, there is likely to be a strong cyclical boom this year. … As a consequence, following a 3.5% contraction in 2020, we now forecast world GDP growth (at current exchange rates) in excess of 6% in 2021, up from 5% previously. …

Over the next several months, a combination of base effects, recent increases in energy prices, and price adjustments in sectors where activity ramps up is likely to push year-over-year inflation rates significantly higher. However, we forecast that much of this rise will reverse later this year.

Here is PIMCO’s outlook for U.S. inflation through 2022, showing an increase to 3.5% in all-items inflation in coming months, before both all-times and core inflation begin settling down to about 2.0% year over year:

Will this be a ‘head fake’?

I don’t claim to know. Inflation is incredibly hard to predict beyond a month or two into the future, and even then, something unexpected can happen, such as a hurricane ripping through Texas and knocking out oil refineries.

Inflation has remained stubbornly low over the last decade, much lower than the bond market or economic experts predicted. The result is that U.S. policymakers and market-makers are complacent about inflation: Even though they can see it rising, they aren’t concerned.

For a perspective on the wanderings of U.S. inflation, take a look at this historical chart of monthly year-over-year inflation, going back to 1948:

It is true that U.S. inflation has been relatively mild for decades, all the way back to October 1990, when it hit 6.4%. A true “head fake” happened in July 2008, when inflation soared briefly to 5.6% before plummeting to -2.1% a year later in July 2009. That steep drop, however, came during the century’s worst economic recession.

So, where are we headed?

Here are some thoughts from inflation watcher Michael Ashton, who writes on inflation in his E-piphany blog:

There is a growing list of categories of prices which are seeing abnormal price pressures. … There has become an acute shortage of semiconductor chips, which has impacted automobile production (and will that increase prices for what is available?). There is a shortage of shipping containers, causing widespread increases in freight costs affecting a wide variety of goods. Packaging materials, which are also a part of the price of a great many goods, are also shooting higher in price. Worker shortages at various skill levels were reported in the most-recent Beige Book. There is a shortage of Uber and Lyft drivers.

Importantly, we should add to these shortages a growing shortage of housing. The inventory of homes available for sale just hit an all-time low … And, as a result, the increase in the median sales price of existing homes just reached an all-time high spread over core CPI. …

But it might also be the case that the current rapid escalation of home prices is the market’s attempt to get the real value of the housing stock to reflect the rapidly increasing value of the money stock. If that’s the case, then it also suggests that median wages probably will eventually follow.

Consider this about the U.S. money supply: the M2 money stock measurement has increased about 26% over the last year, from about $15.5 trillion in January 2020 to $19.6 trillion in March 2021. That’s a sharp difference from the trend we’ve seen during all the years of relatively mind inflation since 1990:

Maybe money supply doesn’t matter, and doesn’t influence inflation. But this chart is strong evidence we have entered a “new era.” On the flip side of this, the value of the U.S. dollar has declined about 7% over the the last year, as shown in this chart:

Increasing consumer demand, supply shortages, possible labor shortages, a soaring money supply, a weaker U.S. dollar: These factors all will contribute to rising inflation over the short term. Will that trend last beyond 2021 or just be a “head fake”?

I don’t know the answer, but think staying prepared for inflation is a wise investment move.

* * *

David Enna is a financial journalist, not a financial adviser. He is not selling or profiting from any investment discussed. The investments he discusses can purchased through the Treasury or other providers without fees, commissions or carrying charges. Please do your own research before investing.

Posted in I Bond, Inflation | 2 Comments

Heads up: Be wary of rolling over a 5-year bank CD

By David Enna, Tipswatch.com

On my way to look something else up, I noticed something interesting: The yield of the nominal 5-year Treasury note has been rising nicely over recent weeks, but yields of 5-year insured bank CDs remain stuck at very low levels. That shouldn’t be happening, but here we are.

As this chart shows, this isn’t an unusual situation. Banks have been pushing customers away from 5-year CDs for several years, preferring to offer attractive 11-month or 1-year CD rates, which can bring new customers into the door. But during the early months of the pandemic, banks held 5-year CD rates relatively stable at already very low rates. Now that the 5-year Treasury yield is rising, banks are standing pat, with the national average 5-year CD rate at 0.30%. The 5-year Treasury yield closed Friday at 0.97%, up a strong 61 basis points this year.

Even when you look at yields for best-in-nation 5-year CDs, they almost always lag well below the 5-year Treasury, which is equal in safety, has no purchase limit and is not subject to state income taxes.

OK, I admit that a 5-year Treasury paying a nominal yield of 0.97% isn’t attractive. But I wonder why some banks don’t adopt a strategy of locking in customers at a 1.2% yield for 5 years, when it seems rather likely that yields could rise substantially in coming years. But the more aggressive, online-oriented banks are focusing on 1-year maturities.

The 1-year Treasury bill is currently yielding 0.07%, while many best-in-nation banks are offering yields of 0.50% and above. For the one-year term, bank CDs are much more attractive, versus Treasurys.

And, for the record, banks like BB&T and Wells Fargo that allow customers to sign up for CDs paying 0.01% interest should hang their heads in shame.

The danger of CD rollovers

My theory is that many banking customers allow their CDs to roll over at maturity, without even checking the current yield. For example, I have an 11-month CD at Ally Bank that will mature in May. It is currently yielding 1.2%. If I allow it to roll over next month, the yield will probably drop to 0.5%, a drop of 70 basis points. Well, at least that’s better than the 0.01% I’m earning in my brokerage cash account.

That Ally rollover isn’t a bad deal, and this is a no-penalty CD, so the money is always available to withdraw if conditions change.

But that’s not the case if you have a 5-year CD maturing soon. Back in 2016 to 2019, it was possible to snag 5-year bank CDs paying well over 2.0% (we used to laugh at that rate, remember?). When those CDs mature, they will be automatically rolled over to new 5-year CDs paying at the best about 0.80%, and maybe much lower.

Your bank should notify you of an upcoming CD rollover. Pay attention, and go shopping. If you are looking for safety, my recommendation is to hunt for 1) online savings accounts paying 0.5% or more, or 2) 1-year CDs yielding 0.5% or more, in a bank you like working with. Ally Bank’s “no penalty” feature is attractive, but it is only offered on the 11-month term. It yields 0.50%, the same as the bank’s online savings account. However, yields on these online bank savings accounts have been drifting lower over the last year.

The 5-year term just isn’t attractive at this point.

However, a new 5-year TIPS will be offered at auction on April 22. I will be taking a deeper look at that investment in a couple weeks.

* * *

David Enna is a financial journalist, not a financial adviser. He is not selling or profiting from any investment discussed. The investments he discusses can purchased through the Treasury or other providers without fees, commissions or carrying charges. Please do your own research before investing.

Posted in Bank CDs | 8 Comments

Frightened by a phantom? TIPS are fine in a taxable account, until …

By David Enna, Tipswatch.com

A couple years ago, just as my wife and I were both retiring, we went through a rigorous financial planning exercise with an hourly-fee adviser. We were in sync on almost all his advice, except when the adviser insisted: “You need to get these TIPS investments out of a taxable account and into an IRA.”

My response: “Not gonna happen.”

For nearly a decade, I had been writing about Treasury Inflation-Protected Securities and I Bonds, both inflation-protected investments. And with TIPS, my routine was to buy them at auction directly from Treasury Direct, and hold them to maturity. I’ve never sold a TIPS before maturity, and I wasn’t interested in moving them out of Treasury Direct and selling them to fund new purchases.

The adviser (the rather famous Allan Roth of Wealth Logic) was totally correct in his advice, which follows the tenets of of proper “asset location.” Taxable investment accounts, in general, should be focused on equity-oriented, low-cost index funds that generate little annual tax exposure, while traditional tax-deferred accounts should focus on interest-bearing bond funds, REITS, insured CDs, and possibly managed stock funds that generate taxable payouts.

Roth accounts, in this asset location theory, should be focused on longer-term equity investments, since this should be the last money you will withdraw in retirement. The longer investment horizon means you can take more risk.

Realistically, TIPS do work best in a traditional (non-Roth) tax-deferred account. That could mean investing in TIPS mutual funds or ETFs, or using a brokerage account to buy Treasurys with (hopefully) near-zero commissions. But while holding TIPS in a tax-deferred account is preferable, I say holding them as a taxable investment at Treasury Direct is also acceptable as part of your overall fixed-income asset allocation. Up to a point. More on that later.

TIPS and the ultra-scary ‘phantom income’

Treasury Direct isn’t user friendly. While every brokerage and investment firm on Earth mails you tax forms (or at least notifies you they are ready to download), Treasury Direct does nothing. You’ll get nothing in the mail, you won’t receive an e-mail alert. You are expected to remember to log in to the site and retrieve your tax forms:

  • Form 1099-INT shows the sum of the semiannual interest payments made in a given year. This income is generated by the TIPS’ coupon rate, and is taxable at the federal level but tax-fee at the state.
  • Form 1099-OID shows the amount the principal of your TIPS increased due to inflation or decreased due to deflation. Increases in principal are taxable for the year in which they occur, even if your TIPS hasn’t matured, so you haven’t yet received that payment of principal.

Form 1099-OID is a key to the conventional wisdom to invest in TIPS in tax-deferred accounts. You are paying tax on money you have not yet received. This is often called “phantom income,” and it sounds scary, doesn’t it? However, if you have a Total Bond Fund or GNMA Fund in a taxable account and reinvest the dividends, or have a 5-year CD at a bank and are reinvesting interest, you are doing exactly the same thing. You are paying tax on money you have not yet received.

(Read this for a scholarly treatise, including incomprehensible formulas, debunking the conventional wisdom about holding TIPS in a taxable account.)

What’s the cash flow?

A common strategy for investments in TIPS is to build a ladder of inflation-protected investments that will stretch into your retirement, with issues maturing each year, which can then provide the money for re-investments or spendable cash. Let’s take a look at a theoretical TIPS ladder, with issues maturing every year through 2029, and then one longer-term TIPS maturing in 2041. It would look something like this (modeled as a typical ladder of purchases at least once a year, sometimes more):

TIPS in a taxable account

This portfolio of TIPS investments in 2021 would pay $2,929 in coupon payments and also generate $6,088 in inflation accruals, based on inflation running at 1.8%. The $6,088 is the “phantom income” that is not paid out in the current year, but is taxable in the current year. As long the coupon payments can cover the tax on the phantom income, you will have a positive cash flow.

Here’s an analysis of the immediate-year cash flow, based on varying tax brackets:

When each TIPS matures, here’s the good thing: You don’t owe any tax on the accumulated inflation-adjusted principal, because you’ve prepaid it. So if you bought a $20,000 10-year TIPS in 2010 and it matured in 2020 with a 18% inflation boost to principal, you collected $23,600 at maturity and owed no tax. This could work in your favor for allocating spending money in retirement.

After retirement, the game changes?

At various times over the last decade — including now — TIPS have been issued with negative real yields to maturity, meaning their returns will not match official U.S. inflation. TIPS haven’t been attractive, and I have haven’t purchased any. This was part of my deal with my financial adviser: I’d let the TIPS I hold at Treasury Direct mature out and then make all further purchases in a traditional IRA brokerage account.

Instead of buying TIPS with the maturing issues, I have re-invested the proceeds in I Bonds, which will at least perfectly match future U.S. inflation. I haven’t bought any individual TIPS issue since a March 21, 2019, 10-year TIPS reopening resulted in a real yield to maturity of 0.578%.

The key problem is: How do you fund net-higher new investments when you no longer have a source of current income? This is difficult in a taxable account when you are retired, because it means either 1) using your cash, which will have to be replenished, or 2) selling other assets in taxable accounts, possibly incurring taxes, or 3) withdrawing money from a tax-deferred account, which will incur a tax. That would make no sense. When you are retired, taxes enter into just about every financial decision .

So the obvious solution is: Use a traditional IRA brokerage account to fund future purchases of TIPS, when yields become attractive again.

But I am fine with my current TIPS investments, which will continue maturing through 2029 and providing cash for other investments, or just for fun in retirement.

* * *

David Enna is a financial journalist, not a financial adviser. He is not selling or profiting from any investment discussed. The investments he discusses can purchased through the Treasury or other providers without fees, commissions or carrying charges. Please do your own research before investing.

Posted in Investing in TIPS, Retirement | 21 Comments

10-year TIPS reopening auction generates a real yield of -0.580%

By David Enna, Tipswatch.com

Reflecting a trend of both rising real yields and rising inflation expectations, the U.S. Treasury’s reopening auction today of a 10-year Treasury Inflation-Protected Security — CUSIP 91282CBF7 — generated a real yield to maturity of -0.580%, an expected result that was higher than recent yields for this term.

This TIPS was created in an originating auction on Jan. 21, 2021, with a record low real yield to maturity for this term, -0.987%. Today’s auction result was 38 basis points higher, a big move in just two months.

A TIPS is an investment that pays a coupon rate well below that of other Treasury investments of the same term. But with a TIPS, the principal balance adjusts each month (usually up, but sometimes down) to match the current U.S. inflation rate. So, the “real yield to maturity” of a TIPS indicates how much an investor will earn above (or below) inflation.

CUSIP 91282CBF7 carries a coupon rate of 0.125%, the lowest the Treasury will allow on a TIPS. Because the auctioned real yield to maturity was well below the coupon rate, buyers at today’s auction had to pay a premium price — about $107.62 for about $100.73 of value, after accrued inflation and interest is added in. This TIPS will have an inflation index of 1.00473 on the settlement date of March 31.

But today’s price was well below the $111.64 cost of the originating auction, which reflects the big increase in real yields over the last two months.

It looks like the auction went off as expected, in line with the trend of overall increases in both real and nominal yields. At mid-morning, CUSIP 91282CBF7 was trading on the secondary market with a real yield of -0.59%, close to the auction result. So, no surprises. However, the bid-to-cover ratio was 2.42, a middling number that reflects decent, but not strong, demand.

Here is the trend in 10-year real yields over the the last two years, showing the brief bounce higher a year ago during pandemic-related market turmoil, and then a deep decline amid economic gloom, and the gradual rise higher since the beginning of 2021 as COVID vaccines were rolled out and Congress approved economic stimulus packages:

This recent rise in yields is driving prices lower for broad-based TIPS mutual funds and ETFs. The TIP ETF is trading down about 0.6% today at a price of $124.81, indicating higher market yields. But today’s auction had little effect on the price, which indicates the result matched expectations.

Inflation breakeven rate

With a nominal 10-year Treasury trading at the auction close at 1.73%, this 9-year, 10-month TIPS gets an inflation breakeven rate of 2.31%, a big surge higher than numbers from similar auctions over the last year:

  • March 19, 2020: 0.43%
  • May 21, 2020: 1.14%
  • July 23, 2020: 1.52%
  • Sept. 17, 2020: 1.65%
  • Nov. 19, 2020: 1.72%
  • Jan. 21, 2021: 2.09%
  • March 18, 2021: 2.31%

Investors are “all-in” in committing to higher future U.S. inflation, given the Federal Reserve’s commitment to continued economic stimulus, combined with the lofty cash payments and credits to individuals included in the newest economic package passed by Congress. But these same forces are driving both nominal and real interest rates higher.

Inflation has been running at 1.7% over the last year, and has averaged 1.7% over the last 10 years. Will inflation move dramatically higher, as the market is predicting? It could happen, but I am thinking the 2.31% inflation breakeven reflected in this auction could be nearing a top, at least until we start to see actual higher inflation in the United States. Future inflation is nearly impossible to predict.

Here is the trend in the 10-year inflation breakeven rate over the last two years, showing the dramatic climb higher from the market depths of March 2020:

What’s ahead?

Today’s auction was the first of two reopenings for CUSIP 91282CBF7. The Treasury will offer another reopening in May, and then offer a new 10-year TIPS in July.

Next month’s offering will be a new 5-year TIPS, with the auction on Thursday, April 22.

Here’s a history of recent 9- to 10-year TIPS auctions:

* * *

David Enna is a financial journalist, not a financial adviser. He is not selling or profiting from any investment discussed. The investments he discusses can purchased through the Treasury or other providers without fees, commissions or carrying charges. Please do your own research before investing.

Posted in Investing in TIPS | 3 Comments