
By David Enna, Tipswatch.com
When I was a kid, my parents encouraged me to open a “passbook savings account” at a nearby savings & loan. As I recall, that account was paying 5% interest. At the time, I wasn’t impressed. Sixty years later, I’d jump for joy over 5% interest.
In the mid 1960s, the Federal Reserve was raising its effective federal funds rate after a recession in the early 1960s pushed it down to 1.17% in July 1961. In mid 1961, U.S. inflation was running at 1.4%, but it began moving higher and by November 1966 it had reached 3.8%. Where was the effective federal funds rate in November 1966? 5.76%, much higher than the rate of inflation.
The point is: Over the last 70 years, it’s been very rare to see the federal funds rate anywhere near zero and well below the annual rate of U.S. inflation. That is to say: Rare, until the last 10 years, when the Federal Reserve has adopted an accommodative policy to keep the U.S. economy (and stock market) ticking higher.
Here is a historical view of the federal funds rate from 1954 to today:

As you can see in the chart, the Federal Reserve kept its key short-term interest rate much higher than the current 2.33% until market crashes/recessions in 2000, 2008 and (briefly) in 2020. The current rate of 2.33% is a historical anomaly, and it has room to move higher based on historical precedent.
Federal funds rate vs. inflation
This next chart shows the federal funds rate in comparison to the annual U.S. inflation rate:

This chart clearly shows that the Federal Reserve, through much of the last 70 years, has attempted to keep its federal funds rate tracking higher than the annual U.S. inflation rate, even going to the extreme of 19.1% in July 1981, at a time when U.S. inflation was running at 10.8%. That extreme action eventually brought inflation down, but the federal funds rate lingered at a high level through much of the 1980s, reaching only 9.85% in March 1989 before beginning a slide downward.
Even after the dot-com crash of 2000, the federal funds rate tracked pretty closely with U.S. inflation. The dramatic change came after the financial crash of 2008, when the effective federal funds rate reached the unprecedented level of 0.16% in December 2008.
Since 2008, the federal funds rate has remained well below annual U.S. inflation except for a brief time in 2019 — for example, 2.4% in July 2019 at a time when inflation was running at 1.8%. This accommodative policy has led to our current surge in inflation. The gap is shockingly high now … 2.33% versus the current inflation rate of 8.3%.
Federal funds rate versus stock market
This chart compares monthly annual gains or losses in the total stock market versus the federal funds rate, from April 1980 to August 2022:
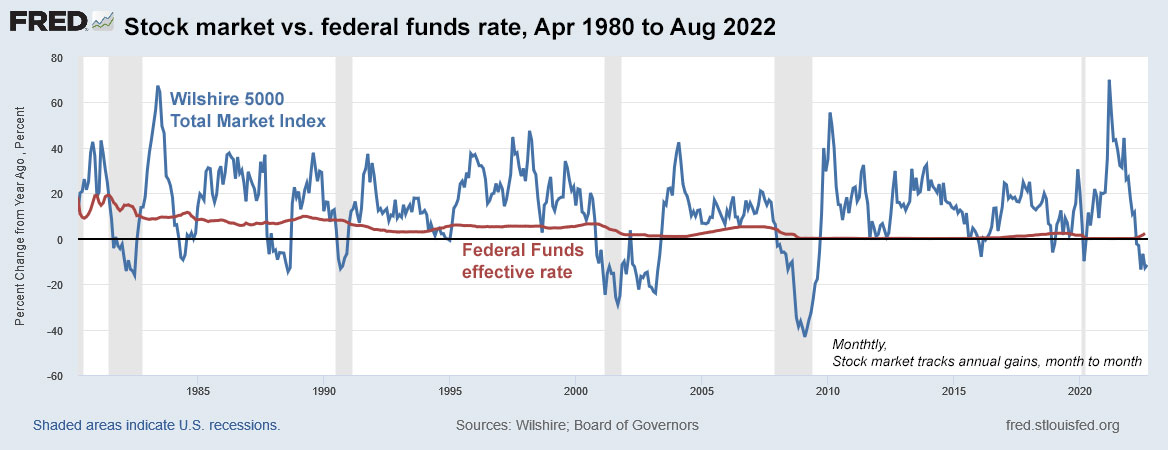
The key point to notice that when the stock market rises, even dramatically, the federal funds rate tends to hold steady. When it declines, especially in advance of a recession, the federal funds rate tends to track lower. The Federal Reserve acts quickly to hold off recessions, and that in turn supports lofty stock market values, at times. When the economy and stock market are booming — especially when inflation isn’t a severe issue — the Federal Reserve stands pat.
Federal funds rate vs. GDP
This next chart provides a historical perspective on the effect of the federal funds rate on the U.S. gross domestic product:

Again, for most of the last 70 years, the Federal Reserve held its key short-term interest rate higher than the annualized changes in the U.S. gross domestic product. If you look at the chart carefully, you can see that the federal funds rate tends to lag behind changes in the economy, rising during times of prosperity and falling during times of recession. But it does not appear to have a dramatic effect on GDP, which tends to tick along in the 2% range, even when the federal funds rate approached zero after 2008.
Conclusion
By historical standards, the Federal Reserve has room to continue to raise the federal funds rate, at least to a level that begins to approach the annual core inflation rate of 6.3%. But that won’t happen, and maybe it doesn’t need to happen. If you assume that inflation will begin drifting lower in future months, it is possible that a federal funds rate of 4% to 5% will hit the mark to keep inflation under control
But the fact is, before the August inflation report was released yesterday, many “experts” were predicting that the Fed would begin rolling back short-term interest rates in 2023 as the economy weakens. And I think that is all too likely.
My preference would be for the Fed to find a true neutral level — say 4.25% to 4.5% — and hold short-term rates at that level for a reasonable period of time, say throughout 2023. No more fiddling. Allow savers and the overall market to find a solid ground for future investments.
* * *
Feel free to post comments or questions below. If it is your first-ever comment, it will have to wait for moderation. After that, your comments will automatically appear.
David Enna is a financial journalist, not a financial adviser. He is not selling or profiting from any investment discussed. The investments he discusses can be purchased through the Treasury or other providers without fees, commissions or carrying charges. Please do your own research before investing.

That gap between the blue and red line on the federal funds rate vs. inflation chart is the reason that as my CD’s mature I’m moving the funds into TIPS.
Thanks to this website I finally understand the deflation risks involved with purchasing TIPS at re-opening auctions and on the secondary market.
I’ve done both in the past when inflation was going-up 1% per month. I figured it was going to take a lot of deflation to eat away at those gains.
Now that the unadjusted inflation rate has been marginally negative for the last two months, I’m going to be a little more cautious.
If the yields remain attractive at the October 5 year auction, I’ll be moving some more of those CD funds into TIPS.
Since this is an original issue auction, the worst case scenario is that I’ll just get par value plus interest if there’s deflation for the entire 5 year term.
That’s another tidbit of information that I learned on this website. It wasn’t until I actually started purchasing/selling TIPS that all of this stuff sunk in!
Thanks for all of the great work that you’ve done in the past on this website. And, the links that you have on it have been invaluable as well.
For me the interest on TIPs is pennies and the real principal gain money has already been made IMHO. I got nothing on my cash for the last 6 years, so the prospect of being just being even is just not for me. I’m staying short term and will lock in the longer-term CD/treasury rates, expecting 5% plus. My income on cash has already increased by 12x so far this year, real significant money. But that is what makes a market. I like Ibonds gains get locked in. TIPs just are not a cash type investment but a speculation.
Sigh. TIPS are not a “speculation.” This is a conservative investment that right now will provide a return 1% above the official U.S. inflation rate. If inflation runs at 5%, as you are speculating, the TIPS will return 6%. I don’t disagree at all with locking in CDs and shorter-term Treasurys with good rates. That is a good strategy, too. If you don’t like TIPS or any non-cash investments, don’t invest in them.
My speculation is that interest rates will be about 5% when inflation drops to 2% and it will happen within a year or 2. Everything overshoots. Certainly, before the next Pres election.
This is close to what you wrote, I think: “So core inflation should sink to 5% or lower, and a federal funds rate of 4.5% would be nearing reasonable”
Even at 4.5% interest rates to 4.5% inflation, I’ll take the CDs since I can lock in the rate longer than tomorrow.
I’m not particularly concerned about deflation losses, at least not any more with a new purchase than all my existing TIPS, which also have that risk, month to month. Next’s week’s 10-year reopening will be interesting. It will carry an inflation index of 1.01972 on Sept. 30, meaning you’d be buying about 2% additional principal, but it also will auction at a fairly large discount, about 96.38 for 100 of par value. I’ll be posting a preview of that auction on Sunday.
David,
I remember those days too. The bankbooks were actually embossed with the interest rate, 5 1/4% not 5.25 but fractional 5 1/4% and as if it was going to be that rate forever.
I have been (dangerously) :} studying various economic theories on inflation. The two concepts that seem to remain consistent among “experts” are:
(1) The “Taylor rule” that says short term rates must be x% over inflation to have a SHORT-TERM reducing effect.
(2) Over a LONG-TERM, inflation will tend toward the interest rate, neglecting shocks.
So seems to me that for (1) to have optimum results since the Fed uses Y/Y infl.%, the Fed will have to hold rates well above Y/Y infl. for a year even if M/M infl. is reducing. Then a gradual reduction to approx. 2% to allow (2) to take effect.
I think this scenario follows close to your conclusion about holding rates at 4.5% for a while (maybe higher) then reducing them. This would allow savers and investors in T bills and notes to “stock up”. That’s what this 83YO is doing. Ultimately unless taxes are raised significantly and/or austerity is implemented (ha ha), or GDP spikes up somehow, I fear we will again head to 0% or devalue so as to not bankrupt the govt. Hope I’m wrong.
That’s one theory, but it is not the theory which the Fed is following (https://www.johnhcochrane.com/s/Phillips.pdf). Yet a third theory says that since inflation is the increase in the money supply (due to budget deficits and Fed creating money), fiddling with interests rates can only delay inflation, not reduce it. With a sudden 40% increase in money (https://fred.stlouisfed.org/series/M2SL) we can expect cumulative 40% inflation before the rate goes back to ~2%. This assumes no more inflationary shocks.
Money supply is definitely a problem, caused by the Fed’s bond purchases, which in reality create money. When the Fed reduces its balance sheet, it lowers liquidity and there is less money. The Fed’s balance sheet was $15.4 trillion in Jan 2020, then increased to $22 trillion in April 2022 and as of August 1 was still at $21.6 trillion, and actually rose slightly in July.
Update: Just after the market close today, CNBC had a “respected” real estate investor’s analysis that the Federal Reserve is causing the housing market to collapse. Of course, didn’t mention that the Fed is the reason housing prices rose 20% in the last year. Conclusion: “The Fed needs to put on the brakes!” …. Then the host called in CNBC’s Fed expert Steve Liesman who asked the panel, “Are you seriously suggesting that interest rates need to get back down to 1%?” …. CASE CLOSED.
I found this post instructive, but I am puzzled by one sentence in your conclusion: “But that won’t happen, and maybe it doesn’t need to happen.”
The “maybe” also implies as a possible outcome: “But that won’t happen, even though it may need to.”?
Are you giving odds on your “maybe”? My own view is that if it needs to happen, it will happen, and devil take the hindmost.
Will the Federal Reserve take short-term rates up to 6.3%? I don’t think it will. I have doubts about 4.5%, even. But I do think core inflation will begin drifting down in future months just because of higher year-over-year baselines. So core inflation should sink to 5% or lower, and a federal funds rate of 4.5% would be nearing reasonable. When a recession looms, and the jobless rate is rising, and the stock market is panicking, what will the Fed do?
Yes, if they don’t care about bankrupting the government. The federal debt in the 80s was a quarter what it is now (per GDP, https://fred.stlouisfed.org/series/GFDGDPA188S). Five years (the average maturity on the federal debt https://www.pgpf.org/expert-views/inflation-interest-and-the-national-debt/rising-interest-rates-threaten-washingtons-solvency) at 4.5% would double the yearly budget deficit.
The 15 wealthiest nations combine for 84.3% of global wealth. Leading the pack is the United States, which holds $106.0 trillion of the world’s wealth — equal to a 29.4% share of the global total. Interestingly, the United States economy makes up 23.9% of the size of the world economy in comparison.
Looks like the FED been doing a great job!
Your second graph shows how far the Fed now is behind the CPI curve. It also shows how the Fed has bailed out the stock market since 2008, at the expense of savers. The prolonged period of historically low (like almost zero) interest rates after 2008 led to the inflation we are now experiencing, especially the incredible inflation in housing prices and the stock market (there is nothing like free money, until it’s not free anymore). At least savers can now get some sort of decent return. For almost everybody else, it’s going to be a bumpy ride.
Agree we need to get back where people can save and get a significant return. Of couse on the flip side TIPs IBonds are better when inflation stays high! So what you wish for depends on your portfolio allocation. I resolve it as rates get to 5% I can lock in some higher returns on cash than the market is free to recover!
I-bonds are great but you can only buy $10,000 a year per social security number (it used to be $30,000). I would be happy with 4% long term, but I may try to wait for 5% (who knows?). Right now banks are sticking it to savers, as usual when rates go up, with the highest rates on bank accounts at around 2.2%, while 3 month Treasury bills are paying 3.1%, six month 3.5%.
Now is the time to start your collection of Ibonds. Some of us here started 20yrs ago and have six figures worth of them. Your stock broker probably has brokered CDs and Tbills. If not get a Schwab or Etrade account. Do a 3 month ladder. Money market can be the first tier. When inflation crosses interest rate then it will time to look longer term.
I’m not sure there is any ‘winning’ position possible at this point, only the “least harmful”. My understanding is that ultra-low interest rates allow the Fed to “inflate” the debt away. So, I guess it’s finding a sweet spot between lowering government debt and pain for the masses or increasing government debt. I’m not sure that sweet spot exists anymore, at least not without fiscal help from the government, (austerity and/or higher taxes)! Good luck with that IMO.
In the meantime, I am an 83YO so I am climbing all over the higher rates in the form of G bills and notes.
Excellent article. The charts are great too. I hope the FOMC members are your subscribers. They MUST read this article.
The present is the past rolled up for action, and the past is the present unrolled for understanding.
-With gratitude + utmost respect
Helpful analysis. Good job.
Thank you for the article, David. Sadly, I think the Fed will continue to meddle like a bunch of reckless day-traders. Stocks up 5%, raise rates! Stocks down 5%, get ready for a rate cut!
I agree, except for the “stocks up” part. The Fed rarely intervenes when the markets are rising.
John, your comment got me thinking and I added a stock market chart to this article. Thanks for the idea.
Nice! The chart adds some good info to the article.