The Treasury’s auction of $21 billion in a new 5-year Treasury Inflation-Protected Security — CUSIP 91282CGW5 — resulted in a real yield to maturity of 1.320%, a bit higher than looked likely through the morning.
Demand appears to have been fairly weak for this 5-year TIPS. The bid-to-cover ratio was 2.34, the lowest for any TIPS auction of this term for as long as I’ve been recording this data (back to June 2019). A similar TIPS was trading on the secondary market all morning with a real yield around 1.29%. So … 1.32% looks good.
Definition: A TIPS is an investment that pays a coupon rate well below that of other Treasury investments of the same term. But with a TIPS, the principal balance adjusts each month (usually up, but sometimes down) to match the current U.S. inflation rate. So, the “real yield to maturity” of a TIPS indicates how much an investor will earn above (or below) inflation.
Pricing: The coupon rate for this TIPS was set at 1.25%. Because the real yield was higher, investors paid an unadjusted priced of about 99.664 for $100 of par value. The inflation index will be 1.00241 on the settlement date of April 28, and that means investors will pay an adjusted price of about 99.91 for about $100.24 in principal. (Plus about 4 cents for accrued interest.)
It’s a small thing, but a lot of TIPS investors tell me they relish the idea of buying a TIPS below par value, because par value is guaranteed to be returned at maturity, even if we hit a period of extended deflation. This TIPS delivered.
The yield. Real yields for all TIPS have risen sharply over the last year, but peaked in fall 2022 and have slid a bit lower since then. Here is the one year trend in the 5-year real yield:
Click on the image for a larger version.
The auction’s result of 1.320% looks in line with the trading range we’ve seen over the last several months. As recently as March 8, the 5-year real yield hit 1.87% but began falling in reaction to the U.S. banking turmoil. It dipped as low as 1.06% on April 6.
Inflation breakeven rate
At the auction’s close, a 5-year nominal Treasury note was yielding 3.63%, giving this TIPS an inflation breakeven rate of 2.31%, which is historically high but looks attractive with U.S. inflation currently running at 5.0%. I’m a bit surprised we didn’t see higher demand for this auction, because the nominal 5-year at 3.63% isn’t very attractive. At least the TIPS protects against unexpected inflation.
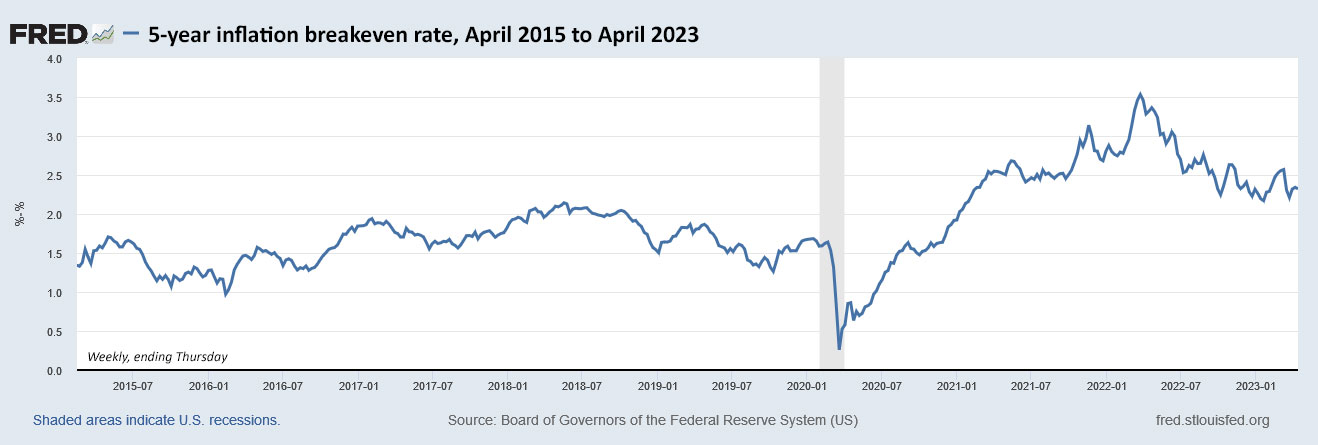
Here is the one-year trend in the 5-year inflation breakeven rate, showing that 2.31% is on the low end of recent rates:
Click on the image for a larger version.
Reaction to the auction
How did the market react to the auction results? With a yawn. The TIP ETF, which holds the full range of maturities, barely budged after the auction’s close at 1 p.m. EDT. So it looks like things went as expected, even though demand was weak.
For investors, getting 1.32% above inflation for the next five years is attractive. Just one year ago, on April 29, 2022, a new 5-year TIPS auctioned with a real yield of -0.340%. Times have changed, huh?
I was a buyer at this auction, fulfilling my wish to bolster the 2028 rung of my TIPS ladder. This TIPS will get a reopening auction on June 22 and then a new 5-year TIPS will be auctioned in October and reopened in December.
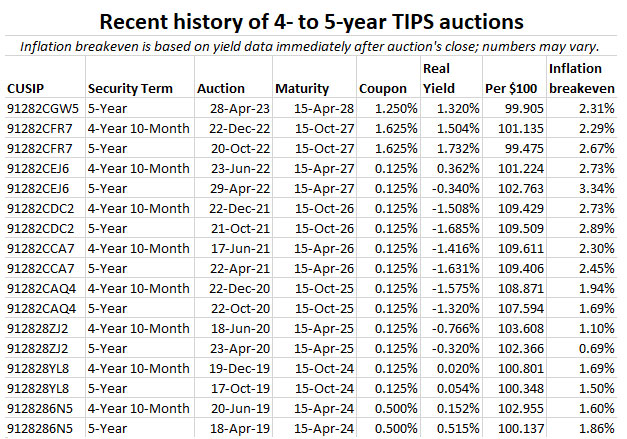
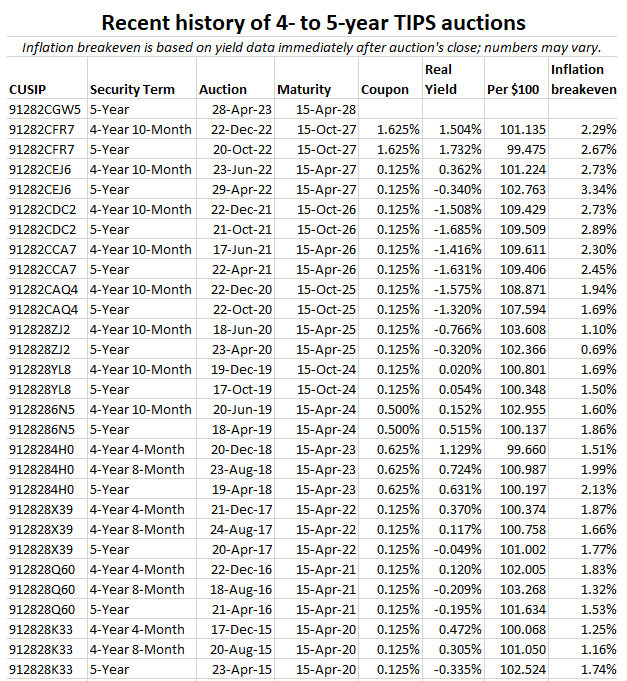
Here is the recent history of TIPS auctions of this term:
Feel free to post comments or questions below. If it is your first-ever comment, it will have to wait for moderation. After that, your comments will automatically appear.Please stay on topic and avoid political tirades.
David Enna is a financial journalist, not a financial adviser. He is not selling or profiting from any investment discussed. I Bonds and TIPS are not “get rich” investments; they are best used for capital preservation and inflation protection. They can be purchased through the Treasury or other providers without fees, commissions or carrying charges. Please do your own research before investing.
Back in spring 2018, the Federal Reserve was continuing its wind-down of quantitative easing, raising its key short term interest rate on March 21 to a range of 1.50 – 1.75%.
That led to a very promising TIPS auction on April 19, 2018 — CUSIP 9128284H0, a new 5-year Treasury Inflation-Protected Security. In my preview article for that TIPS auction, I noted it could be “the most attractive in years.”
The result: At auction CUSIP 9128284H0 generated a real yield to maturity of 0.631%, the highest for any 4- to 5-year TIPS auction since October 2009. The coupon rate was set at 0.625%, the first time in 8 years that any TIPS of this term received a coupon rate higher than 0.125%.
This TIPS got an inflation breakeven rate of 2.13%, compared with a nominal 5-year Treasury note yielding 2.76% at the time.
In other words, everything looked great for an investor in this TIPS. But five years later, how did it actually do as investment? Let’s take a look:
Click on the image for a larger version. Find 10-year data on my TIPS vs. Nominals page.
Conclusion: It did very well
Inflation over the next five years averaged 3.3%, much higher than the inflation breakeven rate of 2.13%. That’s an annual variance of 1.17%. According to data compiled by EyeBonds.info, CUSIP 9128284H0’s compounded rate of return was 4.42%, well above the 2.76% offered by a nominal Treasury (before interest reinvestment).
This TIPS was a winner. Keep in mind that a TIPS investment does especially when inflation runs higher than expected. That’s certainly been the case over the last two years.
I have fond memories of just-matured CUSIP 9128284H0. I invested in it at the opening auction (real yield of 0.631%), first reopening in August (0.724%) and last reopening in December (1.129%).
2018 was a fantastic year for TIPS investment, much like 2023.
Notes and qualifications
This analysis is an estimate of performance.
Keep in mind that interest on a nominal Treasury and the TIPS coupon rate is paid out as current-year income and not reinvested. So in the case of a nominal Treasury, the interest earned could be reinvested elsewhere, which would potentially boost the gain. For certain, we don’t know what the investor could have earned precisely on an investment after re-investments.
In the case of a TIPS, the inflation adjustment compounds over time, and that will give TIPS a slight boost in return that isn’t reflected in the “average inflation” numbers presented in the chart.
Feel free to post comments or questions below. If it is your first-ever comment, it will have to wait for moderation. After that, your comments will automatically appear.Please stay on topic and avoid political tirades.
David Enna is a financial journalist, not a financial adviser. He is not selling or profiting from any investment discussed. I Bonds and TIPS are not “get rich” investments; they are best used for capital preservation and inflation protection. They can be purchased through the Treasury or other providers without fees, commissions or carrying charges. Please do your own research before investing.
The U.S. Treasury on Thursday will auction $21 billion of a new 5-year Treasury Inflation-Protected Security, CUSIP 91282CGW5. The coupon rate and real yield to maturity will be set by the auction results.
For months, I have been considering this auction as a sure-fire purchase, because my TIPS ladder is quite weak for the year this one matures, 2028. I will still be a buyer, but I can see why some investors might opt out. There are equally safe and equally attractive nominal investments out there. And that makes this investment decision complicated.
As of Friday, the U.S. Treasury was estimating the real yield (meaning the yield above inflation) of a 5-year TIPS at 1.29%, well below the 2023-high of 1.87%, set on March 8 just before the Silicon Valley Bank collapse. But 1.29% is okay, in my opinion. Take a look at 5-year real yields over the last 8 years:
Click on the image for a larger version.
After a decade-plus of extremely low or even negative real yields, I can’t complain about getting 1.29% above inflation. It’s fine.
The complicating issue is that you can capture nominal yields with non-callable 5-year bank CDs — either direct or brokered — that are competitive with this 5-year TIPS. A best-in-nation 5-year CD paying around 4.50% creates an inflation breakeven rate of 3.21% against this TIPS, meaning the CD will out-perform if inflation averages less than 3.21% over the next five years.
Will inflation average more than 3.21% through April 2028? I think it’s possible, even likely, but it is going to be close. The CD also looks like a sensible investment. However, forget about the 5-year nominal Treasury note, with a current yield of just 3.60%. The CD and TIPS are much more attractive.
This chart shows how each 5-year investment will perform under different inflation scenarios. At low inflation rates, the bank CD is the winner, with even better real returns if deflation strikes. When inflation rises above 3.21%, the TIPS is the winner, with unlimited upside potential if severe inflation strikes. But there is no scenario where the 5-year Treasury note is the winner.
One thing to consider is that interest from TIPS is exempt from state income taxes, which isn’t true for bank CDs. But if you are putting these in a tax-exempt account, that issue is moot.
So is this Thursday’s 5-year TIPS auction attractive? Yes, it is, as long as real yields hold around current levels through the week. But you could consider pairing it with nominal investments like T-bills (paying 5%+ for a six-month term) or solid bank CDs (paying around 5.15% for 1 year or 4.50% for 5 years.)
Or, just buy the TIPS. It will do fine if you hold it to maturity.
Pricing
If the real yield holds at 1.29%, this new TIPS will get a coupon rate of 1.25% and should be priced just below par. It also will carry an inflation index of 1.00241 on the settlement date of April 28. So at this point the price should be very close to $100 for $100 of par. There will also be a very small amount of accrued interest.
Inflation breakeven rate
The official inflation breakeven rate will be set by the spread in yield between the 5-year Treasury note (currently yielding 3.60%) and the TIPS real yield (let’s estimate 1.29%). That creates an inflation breakeven rate of 2.31%, fairly high by historical standards but fairly low compared with recent auctions.
Here is the trend in the 5-year inflation breakeven rate over the last 8 years:
Click on the image for a larger version.
U.S. inflation has been trending downward over the last year, going from an annual rate of 9.1% in June 2022 to 5.0% in March 2023. I think that trend will continue for several more months before stabilizing around 3.5%. But that is a guess, of course. No one can accurately predict future inflation.
Over the last 5 years, U.S. inflation has averaged 3.3%.
Final thoughts
Although I still plan to be a buyer at this auction, on April 10 I took half of my planned investment and bought a non-callable 5-year brokered CD yielding 4.61%. It’s hard to pass up these attractive nominal yields, even for an inflation-fighter like me.
We are finally in a prosperous time for ultra-safe fixed-income investing, something we didn’t see for more than a decade. Will this trend continue for years? Possibly. I hope so. But enjoy it while it lasts.
If you are considering bidding at Thursday’s auction, keep an eye on the Treasury’s Yield Curve estimates, which update at the close of the market each day. Non-competitive bids at TreasuryDirect must be placed by noon Thursday. If you are putting an order in through a brokerage, make sure to place your order Wednesday or very early Thursday, because brokers cut off auction orders before the noon deadline.
What are your thoughts on this TIPS auction? Post your comments below.
I’ll be posting results Thursday after the auction closes at 1 p.m. EDT. Here is a look at auctions of this term back to 2015. Note that you only have to go back one year, to April 29, 2022, to find a negative real yield:
Feel free to post comments or questions below. If it is your first-ever comment, it will have to wait for moderation. After that, your comments will automatically appear.Please stay on topic and avoid political tirades.
David Enna is a financial journalist, not a financial adviser. He is not selling or profiting from any investment discussed. I Bonds and TIPS are not “get rich” investments; they are best used for capital preservation and inflation protection. They can be purchased through the Treasury or other providers without fees, commissions or carrying charges. Please do your own research before investing.
So here we are, in April’s magical two-week period where we can make a somewhat informed decision about buying U.S. Series I Savings Bonds in 2023.
I Bonds are a U.S. Treasury investment.
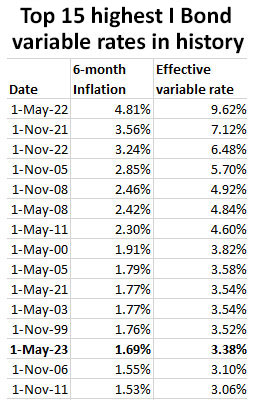
We learned a key piece of information Wednesday with the release of the March inflation report, which set the I Bond’s new variable rate at 3.38%, down dramatically from the current 6.48%. But this drop in yield was expected. U.S. inflation has fallen from a high of 9.1% in June 2022 to the current rate of 5.0%, the lowest since May 2021.
A key thing to understand is that 5.0% is still unacceptably high inflation, reinforcing the importance of long-term inflation protection, which is exactly what the I Bond provides.
But the big difference today versus the last decade is that investors now have equally safe nominal investments with attractively high yields — insured bank CDs, online savings accounts, Treasury money market funds, along with U.S. Treasury bills, notes and bonds.
In addition, there is this obvious alternative: Treasury Inflation-Protected Securities, a more complicated investment that currently offers superior above-inflation returns.
One year ago, in April 2022, you could invest in an I Bond with a yield of 7.12% for six months, then 9.62% for six months. At that time, a 1-year Treasury bill was paying 1.84%. A 5-year TIPS had a real yield of -0.54%. I Bonds were a massively attractive investment in April 2022. Things aren’t so clear today.
So what is an investor to do? First, let’s look at some I Bond basics:
What is an I Bond?
An I Bond is a U.S. government security that earns interest based on combining a fixed rate and an inflation rate.
The fixed rate will never change. Purchases through April 30, 2023, will have a fixed rate of 0.4%. That could change on May 1, when the Treasury resets the rate. It’s possible that rate could go higher, which would benefit people buying after May 1.
The inflation-adjusted rate (often called the variable rate) changes each six months to reflect the running rate of inflation. That rate is currently set at 6.48% annualized. It will adjust on May 1 to 3.38% annualized, based on U.S. inflation from September 2022 to March 2023. The new variable rate will eventually roll out to all I Bonds, depending on the original month of purchase.
The combination of these two creates the I Bond’s composite rate, which is currently 6.89%. The rate after May 1 will depend on how the Treasury sets the fixed rate. If it remains at 0.4%, then the new composite rate will be 3.79%. But remember it could be higher, but only for I Bonds purchased after May 1.
When you purchase an I Bond, you get the current composite/variable rate for a full six months, and then you transition to the next variable rate for a full six months.
Buying in April. April buyers know both the current composite rate (6.89%) and the next one (3.79%), locking in a compounded return of about 5.4% over the next year.
Buying in May. For a May purchase, investors only know the first six-month variable rate of 3.38%. The new fixed rate won’t be announced until May 1.
One key “negative” of I Bonds is that the Treasury limits purchases to $10,000 per person per calendar year. For this reason, I advise people interested in inflation protection to invest in I Bonds up to the limit each year, and continue holding until they really need the money.
Also, I Bonds cannot be redeemed until you own them 12 months. If you redeem them after 1 year but before 5 years, you will lose the last three months of interest. After five years, you can redeem any amount at any time with no penalty.
Is the fixed rate heading higher?
Back on March 9, I wrote an analysis suggesting that Treasury would be likely to raise the I Bond’s fixed rate to somewhere around 0.6% to 1.0% — leading to a guess of 0.8%. But on that very day, Silicon Valley Bank collapsed and we began weeks of financial turmoil, forcing real yields down dramatically. The equation of my highly-thought-out “guess” has changed.
The Treasury has no announced formula for setting the I Bond’s fixed rate, so that means anything I am saying is pure speculation. But my observations — and those of many savvy Bogleheads — indicate that the fixed rate tends to track higher when the real yield of a 10-year TIPS tracks higher. In other words, there is a correlation, but it is not a set formula. It appears to be a formula combined with the whim of the Treasury Department.
The fixed rate is extremely important for an I Bond investor, especially a long-term investor, because it stays with the I Bond for 30 years, or until the I Bond is redeemed. A higher fixed rate is very desirable.
In recent days, without giving this a lot of thought, I have been saying I think the May 1 reset of the fixed rate will fall into a range of 0.4% to 0.6%, but I’d lean more toward 0.6%. Here is an updated chart of the information I am using to make my “guess”:
Most recent real yield theory. On the right side is the equation I have used for years, comparing the potential fixed rate with the most recent real yield of a 10-year TIPS. This technique is hugely inconsistent, but it does a good job of predicting a rise or fall in the fixed rate.
In November 2022, the Treasury set the fixed rate at 0.4%, creating a spread of 118 basis points with the 10-year TIPS. The typical spread in recent years was around 50 basis points, so that 0.4% fixed rate was too low, in my opinion.
But note that since November 2022, the 10-year TIPS real yield has fallen from 1.58% to 1.14%. If you take 50 basis points from 1.14% you get 0.64%, so using this method I think we could see a new fixed rate of 0.6%.
Half-year average theory. On the left hand side of the chart is my newer theory, suggested by readers. To apply this theory, I determined the average 10-year real yield over the rate-setting periods — May to October and November to April for each period the fixed rate was set above 0.0%. Then I calculated the ratio of the new fixed rate to the six-month average.
In the most recent rate reset in November 2022, the fixed rate of 0.40% was 56% of the 0.72% six-month average for the 10-year real yield. If you applied that ratio to current 10-year real yield average of 1.37%, you get a fixed rate of 0.80%, rounded to the tenth decimal point. (Fixed rates are always set to the tenth decimal point, such as 0.40% currently.)
This method lessens the importance of the recent fall in 10-year real yields and points to a new fixed rate of 0.8%, which would be highly attractive.
Conclusion. I’m now guessing a fixed rate of 0.6% to 0.8%. But remember, this is a guess backed up by data, but still a guess.
Higher yield vs. higher fixed rate
Investors buying I Bonds in April get the advantage of locking in a 6.89% composite rate for six months and then 3.79% for six months. So even if the fixed rate rises, buyers in May will need several years to catch up. One of my readers, an Excel whiz who goes by “hoyawildcat,” came up with this explanation of the breakeven periods:
Here are the breakeven dates for I Bonds bought in May (at the new 3.38% variable rate and different fixed rates) vs. I Bonds bought this month (at the current 6.48% variable rate and 0.4% fixed rate).
0.4% — Breakeven: Never 0.5% — Breakeven: April 2040 (16 years 11 months) 0.6% — Breakeven: May 2032 (9 years) 0.7% — Breakeven: June 2029 (6 years 1 month) 0.8% — Breakeven: October 2027 (4 years 5 months) 0.9% — Breakeven: January 2027 (3 years 8 months) 1.0% — Breakeven: May 2026 (3 years)
I’ve seen similar breakeven numbers posted in the Boglehead forum, slightly different, but close enough to get an idea of the April vs. May purchase decision. Most of the Bogleheads seem to be opting for an April purchase.
Remember, you get a ‘mulligan’
While the Treasury limits I Bond purchases to $10,000 per person per year, savvy investors have uncovered a loophole that bypasses that limit: the gift box. This technique works best for spouses or family members, who can each purchase another $10,000 (or more) in I Bonds for each other, deposited in separate gift boxes.
I Bonds placed in the gift box begin earning interest immediately and capture the current fixed rate. When they are delivered in a future year, they apply to that year’s purchase cap for the recipient.
Harry Sit of the TheFinanceBuff.com was the first to write about this strategy on Dec. 27, 2021, in an article titled “Buy I Bonds as a Gift: What Works and What Doesn’t.” When people ask me about the gift box, I point them to this article, which was well researched and thorough. So, go read that article if you don’t know about the strategy.
Some basics of the gift box strategy:
When you place an I Bond into the gift box, it begins earning interest in the month of purchase, just like any other I Bond, and continues earning interest just like any I Bond. However, this money is no longer yours. It belongs to the recipient of the gift.
The purchase does not count against your purchase limit for that year. It will count against the purchase limit for the recipient, in the year it is granted.
Gift purchases are limited to $10,000 for each gift, but you can make multiple gift purchases of $10,000 for the same person. But the recipient can only receive one $10,000 gift a year, and that gift counts against their purchase limit for that year.
You must provide the recipient’s name and Social Security Number when you buy a gift. The recipient doesn’t need to have a TreasuryDirect account … yet. Only a personal account can buy or receive gifts. A trust or a business can’t buy a gift or receive a gift.
“I Bonds stored in your gift box are in limbo,” Harry Sit notes in his article. “You can’t cash them out because they’re not yours. The recipient can’t cash them out either because the bonds aren’t in their account yet.”
The recipient will need to open a TreasuryDirect account to receive the I Bond. Once it is delivered, the money is the recipient’s, who can then cash out or continue to hold the I Bond.
Investment alternatives
A lot of investors have flooded into I Bonds in the last two years, enticed by extremely attractive yields and near-total safety. Those investors were often looking for immediate, short-term returns at a time when savings accounts and money market funds were paying something like 0.05%.
But now, things are totally different. There are many attractive alternatives to I Bonds, such as:
1-year insured bank CD paying 5.1%.
13-week Treasury bill paying 5.02%.
1-year Treasury bill paying 4.64%.
A 5-year TIPS with a real yield of 1.17%, well above the I Bond’s 0.4%.
Online savings accounts paying about 4.1%.
Money market accounts paying more than 4%.
Realistically, I Bonds purchased in April remain competitive, offering a nominal return of 5.4% over one year. But if that I Bond is redeemed in April 2024, the investor loses three months of interest, dropping the yield to about 4.4%. That’s still a good return, but not anything stellar.
I’ve heard from a lot of readers who are planning to bypass buying I Bonds this year and even beginning to redeem I Bonds in coming months as the lower variable rate kicks in. Can’t argue with that, if the investor’s goal is getting the highest near-term yield possible.
I Bonds remain attractive, however, for people seeking to push inflation-protected money into the future, with near-zero risk. I Bonds have better deflation protection than TIPS, have a flexible maturity date and are free of state income taxes. After five years, they become an easily accessible, inflation-protected savings account. You can never lose a penny of principal with an I Bond.
Final thoughts
A month ago, I thought the I Bond’s fixed rate would rise on May 1 to a range of 0.6% to 1.0%. Then came the banking fiasco, and my prediction fell to 0.4% to 0.6%. After writing this article and doing a better analysis, my prediction rises to 0.6% to 0.8%. As I have noted, this is a guess backed up by data.
I am opting to buy our full allocation of I Bonds in April and have set April 26 as the purchase date on TreasuryDirect. If the fixed rate rises dramatically on May 1, I will use the gift-box strategy to add to our holdings. In other words, I can’t lose.
In addition, I most likely will be investing in the new 5-year TIPS going up for auction on April 20. I’ll post a preview article on that April 16.
Later this year, as the lower variable rate kicks in, I may begin redeeming some 0.0% I Bonds that have hit the 5-year mark. Those will become retirement spending money, the reason I bought I Bonds in the first place.
Another viewpoint …
Jennifer Lammer, a YouTube content creator who closely follows I Bonds, just posted this video, reaching a similar conclusion: Buy I Bonds in April, but with a plan to buy more later in the year. There’s a lot of good information here.
What is your strategy? Post your ideas in the comment section below.
Feel free to post comments or questions below. If it is your first-ever comment, it will have to wait for moderation. After that, your comments will automatically appear.Please stay on topic and avoid political tirades.
David Enna is a financial journalist, not a financial adviser. He is not selling or profiting from any investment discussed. I Bonds and TIPS are not “get rich” investments; they are best used for capital preservation and inflation protection. They can be purchased through the Treasury or other providers without fees, commissions or carrying charges. Please do your own research before investing.
The just-released U.S. inflation report for March sets the new inflation-adjusted rate for U.S. Series I Savings Bonds at 3.38%, down substantially from the current 6.48%.
The inflation-adjusted rate, often called the I Bond’s variable rate, is based on non-seasonally adjusted inflation from October 2022 to March 2023, which ran at 1.69%. That number is doubled to create the annualized variable rate of 3.38%. Here are the numbers:
This new variable rate will be combined with a fixed rate (also to be reset May 1) to create the I Bond’s new composite rate for purchases from May through October 2023. The variable rate eventually will be applied to all I Bonds for six months, but the launch date depends on the month of the original purchase.
What does this mean for I Bond investors?
My immediate thinking is that this lower variable rate skews the equation toward making an I Bond purchase in April, to capture the current composite rate of 6.89% for a full six months, before transitioning to a 3.79% composite rate for the next six months.
The one unknown is: Will the Treasury raise the I Bond’s fixed rate on May 1? It’s definitely possible. I have been speculating that the fixed rate will end up in a range of 0.4% to 0.6% at the reset. No one knows. I will be writing more about this later this week.
Another consideration: Investors looking for short-term yield may want to skip buying I Bonds at this point. I Bonds purchased before May 1 will offer an annual compounded return of about 5.4%, which is very attractive. But redeeming before 5 years incurs a three-month interest penalty. That drops the annual return to about 4.4%, slightly less than a 1-year Treasury bill at 4.7%.
Does this fall in the variable rate mean I Bonds are no longer an attractive investment? Absolutely not, but it does probably mark the end of the explosively high demand for I Bonds, caused by successive variable rates of 7.12%, 9.62% and 6.48%. Back to reality: I Bonds should be viewed as an ultra-safe investment that will track or exceed U.S. inflation for as long as you hold them.
As I noted, I will be writing more about this later this week.
The March inflation report
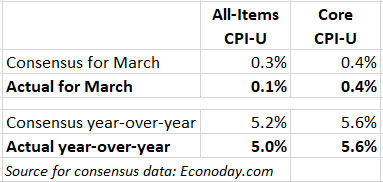
The Consumer Price Index for All Urban Consumers rose 0.1% in March on a seasonally adjusted basis, the U.S. Bureau of Labor Statistics reported today. Over the last 12 months, the all-items index increased 5.0%. Both of those numbers were below consensus estimates, and the year-over-year increase of 5.0% was the smallest since the period ending May 2021.
Core inflation, however, matched expectations with an increase of 0.4% in March and 5.6% year over year. So this inflation report was a mixed bag.
A key factor in moderating all-items inflation was a 4.6% decrease in the price of gasoline, now down 17.4% year over year. On the other side of the equation, shelter costs were up 0.6% and rose 8.2% over the last year. More numbers:
The costs of food at home fell 0.3% for the month, a welcome break after months of raging price increases. It was the first decline in that index since September 2020. Food at home costs are now up 8.4% year over year.
The medical care index fell 0.5% for the month and was up only 1% year over year.
Costs of used cars and trucks fell 0.9% and are down 11.2% year over year.
New vehicle costs rose 0.4% and are up 6.1% for the year.
Apparel costs rose 0.3% and are up 3.3% for the year.
I’d say this was a fairly positive inflation report, given that shelter costs are a lagging indicator and should be declining in future months. But gasoline costs are notoriously volatile, so we can’t expect that downward trend to continue.
Here is the one-year trend for all-items and core inflation, showing that while overall inflation has been declining, core inflation remains stubbornly above 5.5%. The March report marks the first time in over two years that core inflation came in above all-items.
What this means for TIPS
Investors in Treasury Inflation-Protected Securities are also interested in non-seasonally adjusted inflation, which is used to adjust principal balances on TIPS. For March, the BLS set the inflation index at 301.836, an increase of 0.33% for the month. This means that principal balances for all TIPS will increase 0.33% in May, following a 0.56% increase in April.
For the year ending in May, TIPS principal balances will have increased 5.0%. Here are the new May Inflation Indexes for all TIPS.
What this means for future interest rates
Today’s report sends mixed messages. The Federal Reserve can certainly celebrate a dramatic fall in annual all-items inflation, from 6.0% in February to 5.0% in March. But core inflation — considered a more accurate measure — actually rose in March, from 5.5% to 5.6%.
Will the Federal Reserve view this March inflation report as the “positive news” it needs to call a halt to future increases in the federal funds rate? I doubt it. I think we have at least one more 25-basis-point rate increase to go, which would put the short-term rate in the range of 5.0% to 5.25%, finally slightly above the annual U.S. inflation rate.
“May should still tilt to a hike,” said Derek Tang, an economist at LH Meyer/Monetary Policy Analytics in Washington. “But it does take some of the wind out of whether another hike in June will be needed at all.”
Feel free to post comments or questions below. If it is your first-ever comment, it will have to wait for moderation. After that, your comments will automatically appear.Please stay on topic and avoid political tirades.
David Enna is a financial journalist, not a financial adviser. He is not selling or profiting from any investment discussed. I Bonds and TIPS are not “get rich” investments; they are best used for capital preservation and inflation protection. They can be purchased through the Treasury or other providers without fees, commissions or carrying charges. Please do your own research before investing.


I suppose someone can wait 3 more years to buy TIPs, but I plan to just keep on buying TIP…