
By David Enna, Tipswatch.com
This article is the eighth in a series looking at how my three favorite bond funds — Vanguard Short-Term Inflation Protected (VTIP), Schwab U.S. TIPS (SCHP) and Vanguard’s Total Bond (BND) — performed after 2013, when the Fed signaled it would back off on bond purchases and eventually raise short-term interest rates.
Why do this? Because we may be heading into a similar scenario in 2022 and beyond, with the Fed tapering bond purchases and eventually (and gradually) raising short-term interest rates. The performance after 2013 could tell us a lot about what’s ahead.
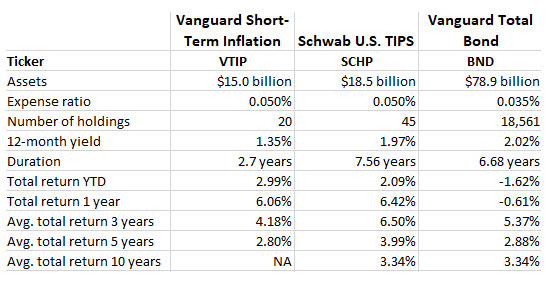
To recap, here are the three bond funds I am tracking; they are three conservative, liquid, mainstream bond funds with very low expense ratios. Here’s a summary of their basic statistics and performance:
2020: A chaotic year of pandemic fears, stunning stimulus
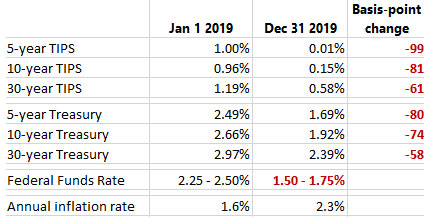
Let’s recall that 2020 started off with U.S. investors fearing a coming recession. In 2019, the Federal Reserve had already cut its key short-term interest rate three times. The yield curve had flattened, and TIPS with terms up to 10 years already had real yields close to zero. On Jan. 24, 2020, a 10-year TIPS auctioned with a real yield of 0.03%, the lowest in seven years.
So the financial markets were already facing low-level chaos. It was about to get a lot worse. Global awareness of the COVID-19 pandemic began rising in January, but gradually. Between January 21 and February 23, 2020, 14 coronavirus cases were reported by U.S. health agencies. The first non-travel case was confirmed in California on Feb. 26, and the first U.S. death was reported on Feb. 29. By March 15, two weeks later, the U.S. had reported 3,485 cases and 65 deaths. One week later, on March 22, the case total rose to 34,000 and deaths reached 413.
The escalating pandemic caused full-out panic in the financial markets. The S&P 500 stock index fell about 25% in the three weeks from March 1 to March 20, plummeting into a bear market. Bond markets were roiled, with yields rising and falling in seemingly random patterns. The financial system was in severe stress.
The Federal Reserve stepped in quickly to calm the markets and Congress soon followed along with a series of historically massive stimulus packages, many of which remain in effect today. Here is a rough timeline of the stimulus pouring into the U.S. economy:
- March 3, 2020: The Federal Reserve cut its federal funds rate by 25 basis points, to a range of 1.00 – 1.25%.
- March 15: Federal Reserve met on Sunday to cut short-term interest rates 100 basis points (effectively to zero) and launched another round of “quantitative easing,” a $700 billion program of bond buying. “There’s no monthly cap, no weekly cap,” Fed Chair Jerome Powell said. “We’re going to go in strong starting tomorrow.”
- March 17: Federal Reserve created a Commercial Paper Funding Facility to protect short-term corporate debt.
- March 18: Federal Reserve created a Money Market Mutual Fund Liquidity Facility to protect funds investing in corporate debt.
- March 20: The Fed opened its money market program to include high-quality municipal debt.
- March 23: The Fed expanded its quantitative easing bond-buying to include mortgage-backed securities.
- March 23: The Fed created the Primary Market Corporate Credit Facility to buy corporate bonds.
- March 26: The New York Fed announced plans to buy corporate bonds and bond exchange-traded funds on the secondary market.
- March 27: President Trump signed into law the $2.3 billion CARES Act, providing a direct cash payment of $1,200 per person, plus $500 per child. It also provided an additional $600 unemployment benefit per week. The CARES Act also created a moratorium on evictions.
- April 6: The Fed announced the Main Street Business Lending Program, that would purchase $600 billion of debt from companies employing up to 10,000 workers or with revenues of less than $2.5 billion.
- April 6: The Fed announced a a new emergency lending facility, the Municipal Liquidity Facility, that would purchase $500 billion of debt from states and cities.
- April 24: Congress passed a $484 billion supplementary stimulus package, mostly to support the Payment Protection Program.
- Aug. 10: Trump, by executive order, extended a $400-per-week payment to those currently receiving unemployment payments.
- Dec. 27: Trump signed a $900 billion stimulus and relief bill that included direct payments of $600 per person, with some income limits. It also continued expanded unemployment benefits.
- March 11, 2021: President Biden signed the American Rescue Plan Act of 2021, a $1.9 trillion package that included direct cash payments of up to $1,400 for individuals earning less than $75,000 a year, plus $1,400 per dependent.
Stimulus. It works.
My focus in these articles is to track how our three bond ETFs — VTIP, SCHP and BND — performed in the period from 2013 to 2021, a time when at first the Federal Reserve was unwinding quantitative easing and ultra-low interest rates, and then a few years later, launching even bigger quantitative easing and returning to ultra-low interest rates.
But I can’t ignore noting that the S&P 500 had a total return of 18.22% in 2020, after falling deep into bear market territory in March.
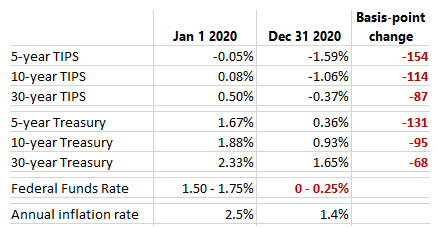
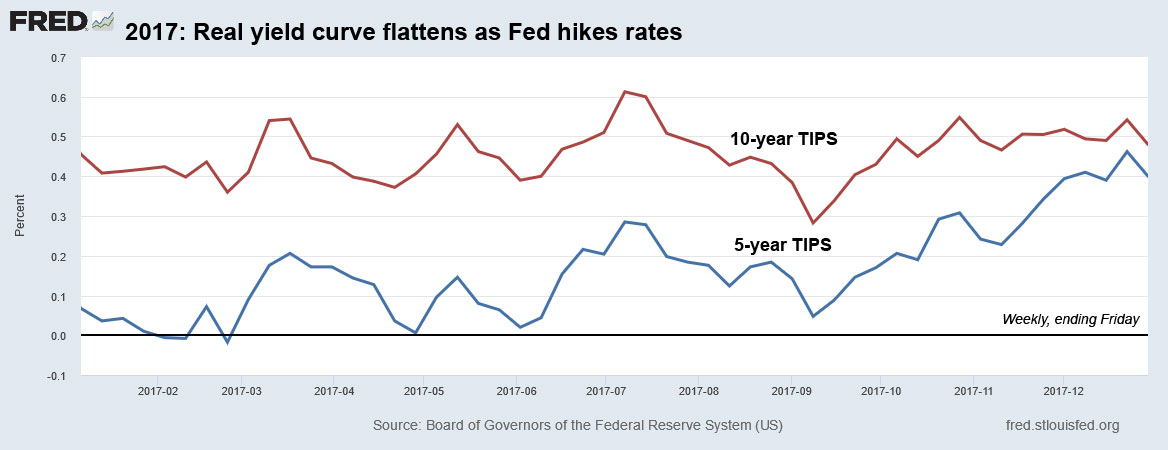
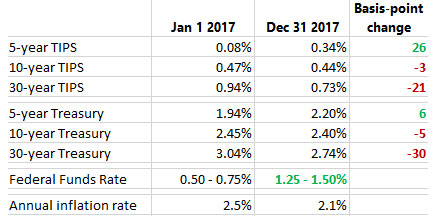
For the bond market, the Fed actions (along with general market chaos) resulted in a deep decline in both real and nominal interest rates. Real yields took a deeper fall, as investors began realizing all this stimulus raised the specter of rising inflation:
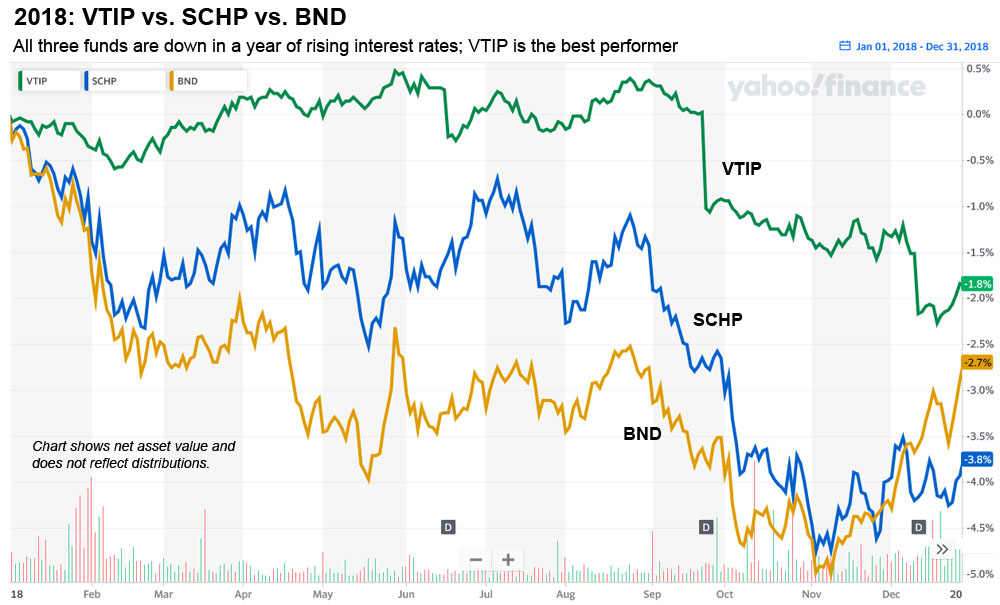
All of this was “very good news” for the bond market (and especially TIPS) in a very bad year of locked-down life in the United States. Here is how our three funds performed, with the chart showing net asset value, excluding distributions:
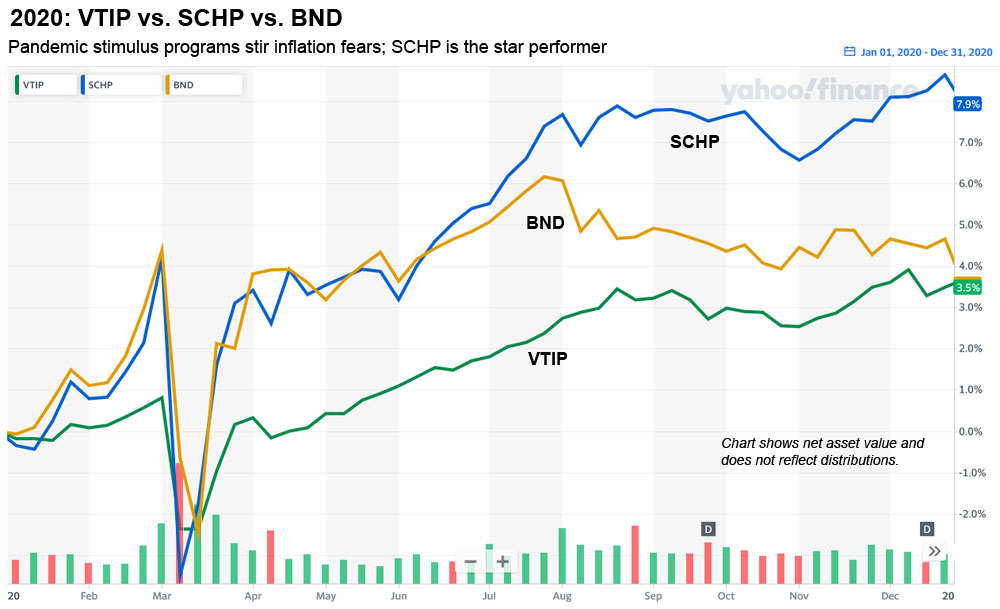
Just like the stock market, the bond market took a beating in March 2020 as financial chaos set it. This is why the Federal Reserve stepped in (on March 15, a Sunday) to slash short-term interest rates to near zero. Four days later, the Treasury staged a reopening auction of a 10-year TIPS, CUSIP 912828Z37, that resulted in an inflation breakeven rate of 0.43%. That’s right, in mid-March 2020, investors expected inflation to run at 0.43% over the next 10 years. The real yield at that auction came in at 0.68%.
But things turned around quickly as stimulus poured into the system. By May 22, CUSIP 912828Z37 had another reopening auction and got a real yield of -0.47%, a drop of 115 basis points in 2 months. Its inflation breakeven rate was 1.14%. Things were clearly settling down as the Federal Reserve began aggressively buying bonds at a rate of $120 billion a month.
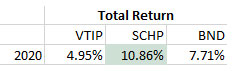
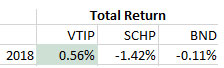
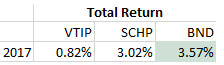
Inflation dipped in 2020 to an annual rate of 1.4%, which dampened the return of the TIPS funds, but rising inflation expectations gave those funds a boost in net asset value. Schwab’s U.S. TIPS ETF, SCHP, was easily the top performer of the year for this group, but both BND and the shorter-term and less-risky VTIP also had very good years.
Conclusion
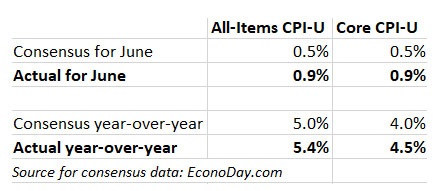
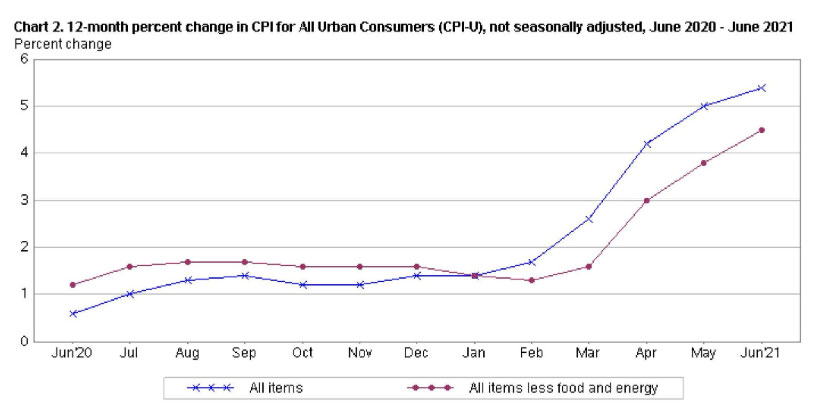
Although 2020 ended up being an excellent year for both bond and stock investors, let’s hope we never have to relive a year like that. The Federal Reserve and Congress acted to stave off financial disaster, and we are living with the result of those actions today as U.S. inflation soars to 5.4%, a 12-year high.
The events of March 2020 stunned me. When the Federal Reserve announced a new wave of quantitative easing on March 15, my immediate reaction was that real yields for TIPS would be heading lower — probably deeply negative to inflation. And yet, four days later, a 10-year TIPS got an auctioned real yield of 0.68%, about 65 basis points higher than expected. This was financial panic in action. The Federal Reserve’s actions halted that panic and then my logic held true: a 10-year TIPS is now yielding -0.94%.
Coming tomorrow: A look at 2021 and beyond
- 2013: A year of surging real and nominal yields
- 2014: The deck was stacked against TIPS funds
- 2015: The Fed actually did something!
- 2016: Inflation rises; TIPS out-perform the overall bond market
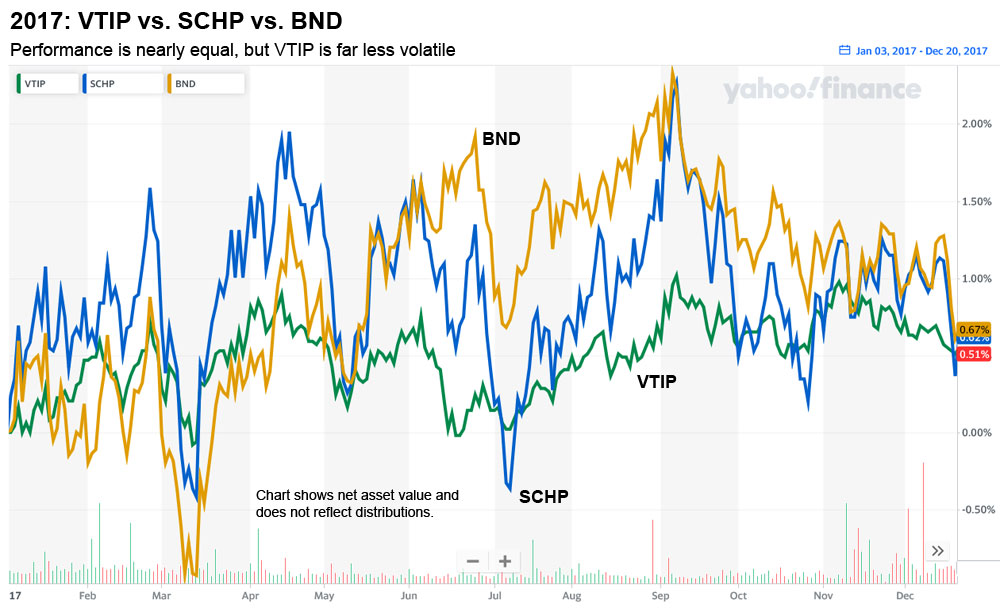
- 2017: ‘The calm before the storm’
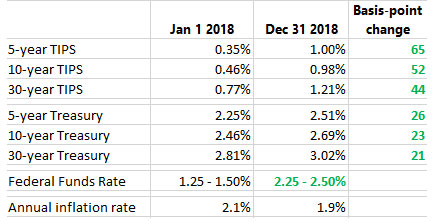
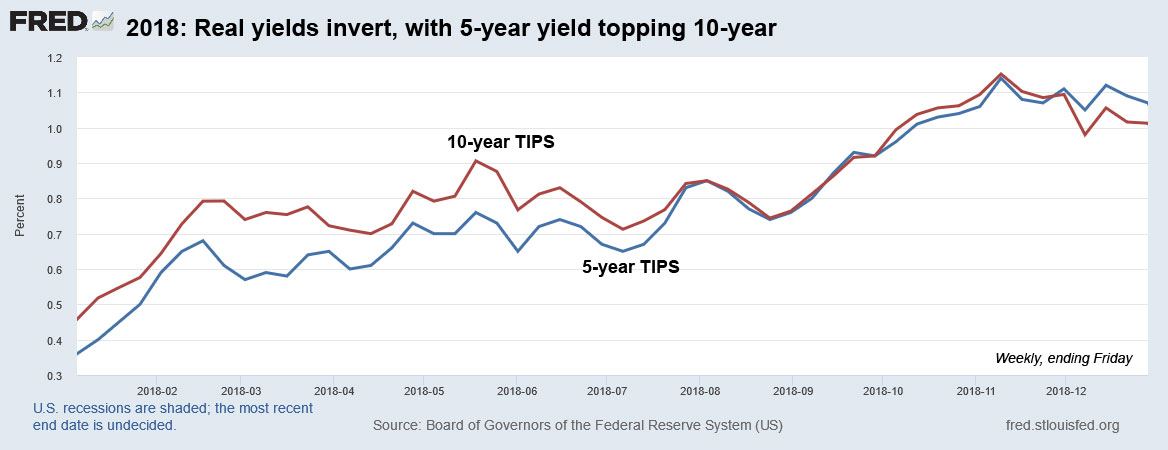
- 2018: Did the Federal Reserve go too far?
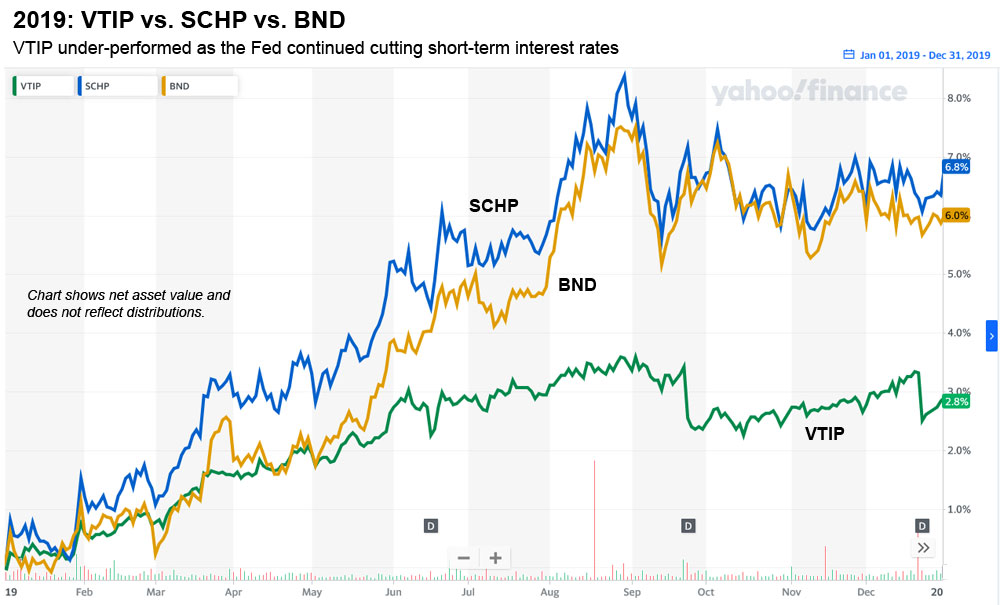
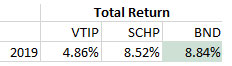
- 2019: The Fed cries ‘uncle’; bond investors celebrate
- 2021 and beyond: What’s ahead for U.S. financial markets?
* * *
David Enna is a financial journalist, not a financial adviser. He is not selling or profiting from any investment discussed. The investments he discusses can purchased through the Treasury or other providers without fees, commissions or carrying charges. Please do your own research before investing.

https://www.wsj.com/finance/investing/the-investment-that-can-shield-you-in-uncertain-times-36c1d850 Mr. Enna in the WSJ today :-)