
It seems like the Treasury market has been on a wild ride in 2015, but in reality there’s been a lot of roiling around to get us back – pretty much – where we started the year. That is summed up by this chart, which shows the year-to-date performance of the TIP ETF:
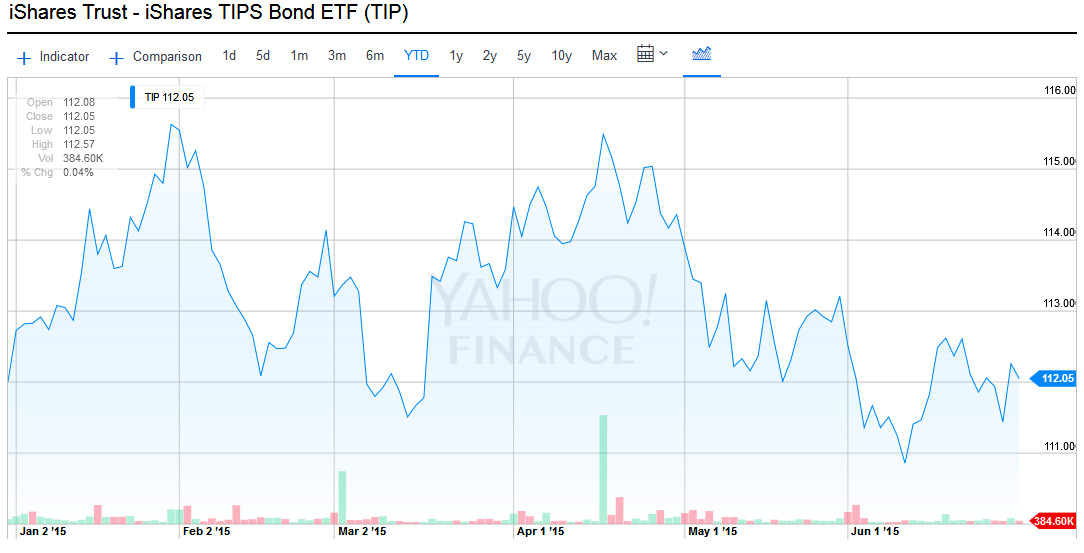 The TIP ETF, which holds a broad range of maturities of Treasury Inflation-Protected Securities, started the year on Jan. 1 at $112.01 and closed Tuesday at $112.05, almost exactly flat. Add in some small distributions and you have a total return right around 1%; Yahoo Finance pegs it at 1.07%.
But as the chart shows, it has been a ‘wild’ ride – at least for a conservative Treasury investment – with the ETF hitting a year-to-date high of $115.63 on Jan. 30 before dipping to $111.51 on March 13, then rising again to $115.49 on April 17, then dipping again to a year-to-date low of $110.75 on June 10.
Keep this in mind: When the price of the ETF rises, TIPS yields are declining. When it drops, TIPS yields are rising. Buy-and-hold investors in TIPS want to see higher yields.
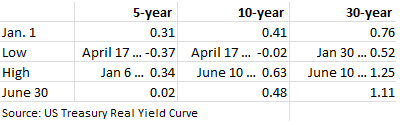 The chart at the right shows highs and lows for the year for the three TIPS maturities available at auction. What’s interesting here is that yields have fallen on short-term TIPS while rising slightly for the 10-year and more sharply for the 30-year.
At the beginning of the year, there was only a 45-basis-point advantage in buying a 30-year TIPS versus a 5-year TIPS. That was ridiculously low. That spread has now grown to 109 basis points as 30-year yields rise to more reasonable levels.
The TIP ETF, by the way, isn’t very diversified, since there are only 39 TIPS currently trading on the secondary market. Of those, 16 have maturities of 5 years or less. Another 16 have maturities in the 5+ to 15-year range. That leaves only 7 with maturities above 15 years. So the ETF is more influenced by price swings in short-term TIPS, and its price was supported in 2015 as short-term yields fell, balancing off rises in longer-term yields.
When the TIP ETF bottomed out on June 10 at $100.75, the 10-year TIPS was yielding 0.63%. This trend, if it continues, could make TIPS investments interesting again. As yields approach 1% above inflation, the 10-year becomes attractive versus a US Savings I Bond, which currently pays 0.0% above inflation but has tax and maturity advantages.
(However, the I Bond’s fixed rate, which will be updated Nov. 1, tends to rise above 0.0% when the 10-year TIPS yields approaches 1.0%.)
Here is the long-term picture for 10-year TIPS yields. In this historical perspective, a yield of 1% above inflation looks pretty paltry. But it would be a big improvement over the last five years of ultra-depressed yields.


Is that a typo in your 3rd graf, Dave? It looks like the June 10 YTD low was $110.75. If it did dip to $100.75, we missed an arbitrage opportunity!
Yes indeed. Thank you Mark, and now it is fixed.
Hmm, I’d take one percent on a ten year with the assumption I’d hold to maturity.
Meanwhile Zillow reports rents increased at an annual rate of 2.7% nation-wide for the last five years. Rents are usually calculated to be 30-33% of the tenant’s income, so once again I seriously doubt the accuracy of the CPI-U.