
By David Enna, Tipswatch.com
Here’s a quick overview of today’s inflation report:
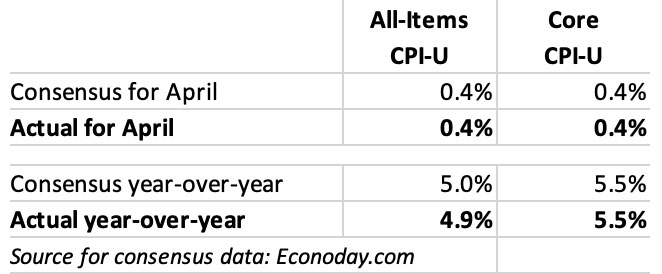
The Consumer Price Index for All Urban Consumers (CPI-U) rose 0.4% in April on a seasonally adjusted basis, the U.S. Bureau of Labor Statistics reported today. Over the last 12 months, the all-items index increased 4.9%.
Core inflation, which removes food and energy, increased 0.4% for the month and 5.5% year over year.
All of these numbers either matched or came close to economist estimates, so no surprises. Although inflation increased 0.4% in April, up from 0.1% in March, the annual all-items number declined from 5.0% to 4.9%, a slight bit of good news. The annual inflation rate has now fallen 11 months in a row. More worrisome is the fact that core inflation is holding steady around 5.5%. Here is a look at all-items and core inflation over the last year:

The BLS noted that the index for shelter (up 0.4% for the month and 8.1% for the year) was the largest contributor to the monthly all items increase, followed by increases in the index for used cars and trucks (up 4.4% for the month) and the index for gasoline (up 3.0%). Food prices, which have been moderating in recent months were up 0.4% for the month and 4.9% year over year. The BLS said the cost of food at home showed no change in April.
What this means for TIPS and I Bonds
Investors in Treasury Inflation-Protected Securities and U.S. Series I Savings Bonds are also interested in non-seasonally adjusted inflation, which is used to adjust principal balances for TIPS and set future interest rates for I Bonds. For April, the BLS set the inflation index at 303.363, an increase of 0.51% over the March number.
For TIPS. The April inflation report means that principal balances for all TIPS will increase 0.51% in June, after increasing 0.33% in May. For the 12 months ending in June, principal balances will have increased 4.9%. Here are the new June inflation indexes for all TIPS.
For I Bonds. The April inflation report is the first of a six-month string that will determine the I Bond’s new variable rate, which will be reset Nov. 1, 2023. So far, one month in, inflation has been running at 0.51%.
One thing to keep in mind as we continue into summer is that non-seasonally adjusted inflation tends to run higher than seasonally-adjusted from January to June, and then lower from July to December. So the next couple months could indicate a higher number than reality. Here are the data:

What this means for future interest rates
There’s nothing in this April inflation report that would take the Federal Reserve off its course to hold the federal funds rate in the range of 5.00% to 5.25%. The April numbers matched expectations, and even though annual all-items inflation is gradually declining, inflation remains unacceptably high.
Final thoughts
I am writing this on board a 16-passenger ship moored just off of the town of Puerto Villamil on Gallapagos’s Ilsa Isabela. Today I was lucky enough to have a very slight internet connection; enough to get this posted. But first, I went snorkeling in a pretty area accompanied by four or five friendly and curious sea lions. It’s been a good trip so far.
* * *
Feel free to post comments or questions below. If it is your first-ever comment, it will have to wait for moderation. After that, your comments will automatically appear.Please stay on topic and avoid political tirades.
David Enna is a financial journalist, not a financial adviser. He is not selling or profiting from any investment discussed. I Bonds and TIPS are not “get rich” investments; they are best used for capital preservation and inflation protection. They can be purchased through the Treasury or other providers without fees, commissions or carrying charges. Please do your own research before investing.

The 4 week t-bill results are in. No big surprises this time.
The Investment Term and Type of Security 28-Day Bill
CUSIP Number 912797FN2
High Rate 5.605%
Allotted at High 34.55%
Price 99.564056
Investment Rate 5.723%
Although it is a very good rate, it is only for 4 weeks
The 8-week rate surprised me, dropping to 4.793% from last week’s 5.537%. I wish there were a reliable way to know the rate in advance. I’ve been tracking Fidelity and Vanguard’s prediction, along with the Treasury’s previous day, but none of them seem to track the auction rate very well.
How about “slowing upward trend” in the title as better serving your audience?
David,
This is post #3 from me in just a few minutes. I’m so sorry to spam your comments, but unfortunately the system is mangling the post which I’ve been trying to make.
I finally figured out what’s happening. In my original post #1, I used the math symbols for “less than” and “greater than” when discussing potential levels of inflation. It appears that the system interprets those symbols as markdown code to cut out all the text which appears between them.
So the result is that my original post was jumbled so that the text becomes nonsensical.
I thought the easiest solution for you is to send you here my original post, where I replace the symbols for “less than” and “greater than” with text. That way the system will (hopefully) not unexpectedly cut out text. I pasted the comment below. You can just post it as the only comment by me, and then delete my original post #1, my comment #2, and this comment #3.
Sorry for the mess. At least I feel better that it’s a system issue, rather than my repeated idiocy lol.
Best wishes,
Adam
The Original, correct comment follows below:
——————————-
David,
I’d like to ask how real interest rates will react under different scenarios in the economy over the next few years.
Obviously anything can happen in the future, and predictions of the economy aren’t worth a lot. But I care because invest a large part of my retirement savings in TIPS. So I’ve been playing with broad ideas of different scenarios for the economy and how each would impact real interest rates.
Economists, investors, and other financial professionals discuss different scenarios frequently, but rarely or never analyze how real interest rates would react. There are endless discussions of the stock market under different economic scenarios. And although not as frequent as the stock market, nominal bonds/Treasury market are still discussed as well.
But regarding real rates, I find very little analysis publicly available (which seems odd to me, given the fundamental impact of real rates on every aspect in the economy). I’d imagine that analysts/traders in banks and investment funds examine real interest rates in depth, but I haven’t been able to find any publications or analysis from them which is available to me as a member of the general public.
That’s why I’m writing to you. I love your site, appreciate your detailed explanations of inflation bonds, your years of dedication to the topic, and your focus on the individual investor. By far the best resource available on TIPS.
So I’d like to get your ideas to understand how real rates would be affected by different economic scenarios. I think it would be valuable for readers.
Additionally, would you or your readers know of good publicly available resources/analysts about real rates? Discussion, analysis, future predictions, etc.
To start the brainstorming, some economic scenarios which I’ve seen discussed often:
– Soft-landing/no-landing:
The US economy grows strong with no slowdown, US labor market stays strong, inflation falls to under 3%, Fed gradually lowers rates.
– Stagflation:
US economic growth slows significantly, US unemployment rises to over 5%, US inflation stays at over 4% (even up to, say, 8%), Fed keeps rates high and perhaps even raises higher.
– Big recession:
US economy negative growth, world economy weak, perhaps triggered by a crisis in something like commercial real estate or regional banks or even a global geopolitical crisis. Inflation might slow because of weaker economy, or might stay high depending on the recession trigger.
How does the real rate curve react in these different scenarios?
Thank you, and best wishes to you on your Ecuador trip.
Adam
Thank you for the timely update and reminder that non-seasonally adjusted inflation tends to run higher than seasonally-adjusted for Jan – June. Safe travels.
The Fed only cares about month to month core inflation. The trend since Nov 2022 is slightly upward. The Fed also cares about real earnings. Month to month change in real earnings: Mar 2023 -.4%; Apr 2023 -.1%; May 2023 +.1%. That trend is definitely up. Perhaps we are seeing the beginning of the dreaded wage-price spiral. In any case, to get inflation down to 2%, Fed has much work to do. Higher, longer.
I totally agree. On top of this it worries me that the yield curve is brutally inverted, with the Fed funds yield 55% higher than the 10 year treasury. This means that if the Fed stops raising interest rates and high inflation lingers for 2-3 more years there could be a big recession and a straightening of the curve which could make longer maturity bond yields go through the roof.
The inverted yield curve has been a good predictor of recessions in the past. It has been inverted for many months, but employment numbers show no sign of recession. Long term bond prices are just guesses by big investors about future interest rates. So far, they have been wrong, but we are early on.
Galapagos is in my bucket list… but I’ve know Ecutorean residents that have lived in Guayaquil all their lives (literally, they are dead now) and never been there!
Hi
I’ve been following your T Bill Purchasing suggestion of monthly 3 month bill purchases and 6 month bills every two months….in light of the debt ceiling commotion would you suggest not to buy this month
I am not changing my strategy and I’m just letting rollovers happen as scheduled.
Tbill% of overall fixed income?
Composition of fixed income portfolio?
Average maturity of all fixed income?
You have at least seven years maturity, for ex, from your original Isavings bond purchases back in those few/good old days of 3%+fixed rates in 1998-2001. But, look at all the rest from ongoing Ibond purchases, ETFs, TIPS and CD/bond holdings at brokerages.
Who takes the time to add it all up and then at least know the average maturity facts and rates? I have tried – not easy to do. Paper savings bonds inventory and then TD online savings bonds as another example.
So inflation is gradually declining, or stubbornly persisting? For my money, the core inflation tells the story. Wonder if the Federal Reserve will agree.
Yes, it’s stubborn, but a year ago in June 2022 inflation was running at 9.1%, so the decline is there. The Fed knows inflation is still too high.