A 10-year TIPS matured Sunday. How did it do as an investment?

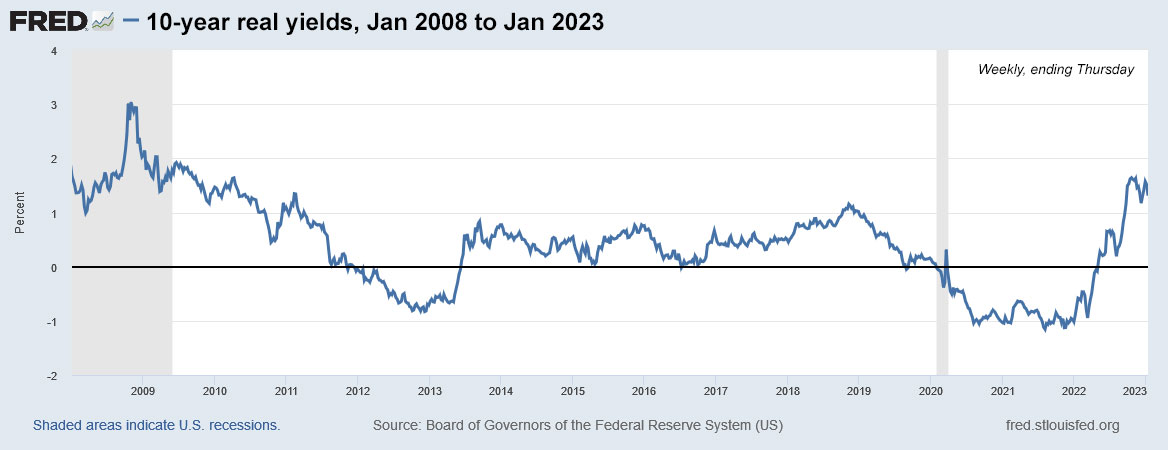
Despite a real yield deeply negative to inflation, CUSIP 912828UH1 outperformed a nominal 10-year Treasury.

By David Enna, Tipswatch.com

Sometimes what looks like a perfectly awful investment will end up surprising you. That is the case with CUSIP 912828UH1, a 10-year Treasury Inflation-Protected Security that had an originating auction on Jan. 24,2013. It matured Sunday, 10 years later. So how did it do as an investment?

The originating auction got a real yield to maturity of -0.630%, a really bad-looking number. It means investors were willing to accept a return 0.630% less than inflation over the next 10 years. Why would they do that? Because yields for all safe investments were deeply depressed. At the time, a 10-year Treasury note had a nominal yield of 1.86%, also highly unattractive.

So this ends up being a matter of which ugly-duckling investment did better if purchased in January 2013 — a 10-year TIPS or a 10-year Treasury note?

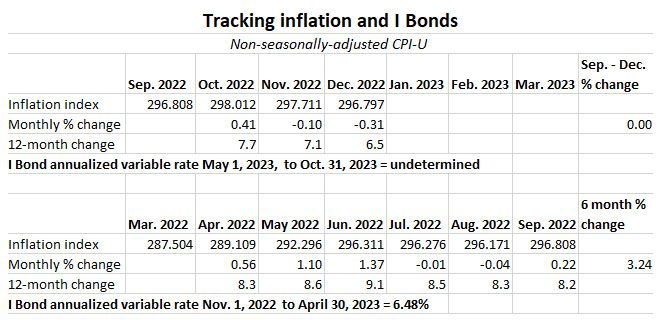
The auction set CUSIP 912828UH1’s coupon rate at 0.125%, the lowest the Treasury will go for a TIPS. And its 10-year inflation breakeven was a lofty 2.49%, much higher than today’s rate of 2.18%, even after two years of ultra-high inflation. In January 2013, annual inflation was running at 1.6%, versus today’s 6.5%.

All of this makes CUSIP 912828UH1 look like an awful investment.

In reality … not so bad

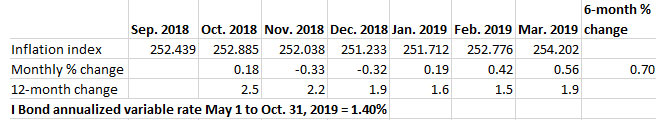
This TIPS ended its life Sunday with an inflation index of 1.29050, meaning it got a cumulative gain from inflation of about 29.1%, or an annualized increase of about 2.6%. Since the inflation breakeven rate was 2.49%, it outperformed the 10-year nominal Treasury by about 0.11% a year. Not spectacular, but this does demonstrate that even a TIPS with a negative real yield and a high inflation breakeven rate can turn out to be a “relatively” good investment.

For most of the last 12 years, TIPS have under-performed nominal Treasurys of the same term, because inflation ran at unexpectedly low levels through much of that time. But the trend has reversed because of the high inflation of the last two years.

Click on the image for a larger version.

My investment in 912828UH1

I didn’t buy at the originating auction, but I did cave in at the May reopening and bought $15,000 of par value, getting a “more attractive” real yield to maturity of -0.225%. This was in a taxable account at TreasuryDirect, and the inflation breakeven also was more attractive at 2.14%. I had to pay $15,511 because of the premium price and inflation index of 1.00837. This TIPS matured Sunday and TreasuryDirect delivered $19,357.50 to my bank account.

That’s a gain of 24.8% on my purchase price, plus I collected 0.125% annually, rising with inflation. So the annualized return was around 2.6%. Was it a great investment? Not really. But good enough. And now I have cash to fund my I Bond purchases in 2023.

One more thing: A followup

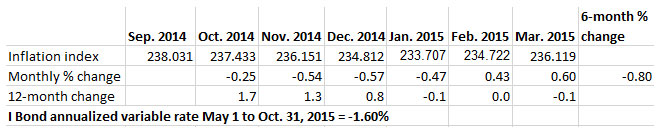
Back in early September I wrote an article titled: “What’s up with those crazy real yields on ultra-short-term TIPS?” In the article I used CUSIP 912828UH1 as an example, because I was getting a lot of questions about it, based on this market quote showing a gaudy real yield of 4.047%:

The article explained that because there was only one more coupon payment remaining, and only a few months of highly iffy inflation accruals, the market was probably pricing this issue correctly. Go back and read the article, if you want, but I said it looked like buying on Sept. 1 at the then-current price would result in an annualized return of about 4.28%, better than the yield at the time on a 6-month Treasury, then at 3.34%.

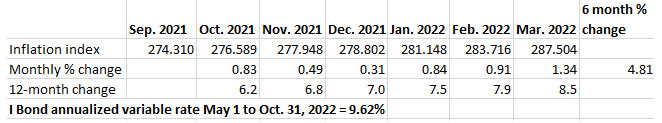
But it did a bit better than that. Here is how it turned out:

So an investor putting $10,000 into this TIPS on Sept. 1 ended up with an investment return of $252, which equates to a nominal return of 2% in 4 1/2 months, or an annualized return of 6.0%, much better than what a 6-month Treasury was paying at the time.

Notes and qualifications

My TIPS vs. nominals chart is an estimate of performance, because annualized inflation rates are based on a full month of inflation in the beginning and ending months, when actually TIPS accruals are based on a half month for the first and last months, with the origination and maturity occurring on the 15th of the month.

Keep in mind that interest on a nominal Treasury and the TIPS coupon rate is paid out as current-year income and not reinvested. So in the case of a nominal Treasury, the interest earned could be reinvested elsewhere, which would potentially boost the gain. For certain, we don’t know what the investor could have earned precisely on an investment after re-investments.

In the case of a TIPS, the inflation adjustment compounds over time, and that will give TIPS a slight boost in return that isn’t reflected in the “average inflation” numbers presented in the chart.

Confused by TIPS? Read my Q&A on TIPS

TIPS in depth: Understand the language

Upcoming schedule of TIPS auctions

* * *

Feel free to post comments or questions below. If it is your first-ever comment, it will have to wait for moderation. After that, your comments will automatically appear.Please stay on topic and avoid political tirades.

David Enna is a financial journalist, not a financial adviser. He is not selling or profiting from any investment discussed. I Bonds and TIPS are not “get rich” investments; they are best used for capital preservation and inflation protection. They can be purchased through the Treasury or other providers without fees, commissions or carrying charges. Please do your own research before investing.

Posted in Inflation, Investing in TIPS, TreasuryDirect | 5 Comments

The first 10-year TIPS of the ‘new era’ will auction Thursday. Interested?

By David Enna, Tipswatch.com

It’s almost hard to believe, but this new age of higher interest rates is only about seven months old. A lot has changed in the last year.

Back on Jan. 14, 2022, a 10-year Treasury Inflation-Protected Security had a real yield of -0.66%. In other words, an investor was accepting a return that would trail official U.S. inflation by 0.66% for 10 years. By April 1, that yield had “increased” to -0.41%. By June 1, it was 0.29%. And now, in mid-January 2023, the 10-year TIPS has a real yield of 1.31%, 197 basis points higher than a year ago.

And weirdly, that is a bit disappointing. According to Treasury estimates, the 10-year real yield peaked last year on Oct. 20 at 1.73%. Since then, a series of rather mild inflation reports has the bond market gambling on a Fed pivot, weaker economy and lower mid- to long-term interest rates. So real yields have been sliding lower, bit by bit, in recent weeks.

Source: Treasury estimates

At the end of last week, we got a little reprieve, following a day of bond market turmoil Thursday triggered by a deflationary December inflation report. As of Friday’s market close, the Treasury was estimating the real yield of a full-term 10-year TIPS at 1.31%, down 22 basis points since the beginning of the year.

All of this points toward Thursday’s Treasury offering of $17 billion in a new 10-year TIPS — CUSIP 91282CGK1. The coupon rate and real yield to maturity will be set by results of the auction, which closes at 1 p.m ET Thursday. This is going to be the first new 10-year TIPS to be auctioned in this new era of higher real yields, and the results will be significant:

  • Real yield. If current trends hold (not a sure thing with our current volatility) this TIPS should get a real yield to maturity of about 1.31%. Only two auctions of this term — both late last year — have had a real yield higher than 1% since November 2018, at the very end of the Federal Reserve’s last tightening cycle.
  • Coupon rate. A real yield of 1.31% would result in a coupon rate of 1.25%, the highest for any 10-year TIPS since a new issue in January 2011. There have been 72 opening and reopening auctions of this 10-year term since 2011. That is a long time and a lot of auctions. So Thursday’s auction will mark a milestone.
  • Inflation index. CUSIP 91282CGK1 will have an inflation index of 0.99948 on the settlement date of Jan. 31. That is because non-seasonally adjusted inflation ran at -0.1% in November. And then … the inflation index will continue to go lower in February, based on -0.31% inflation in December. The big-money investors are going to price this in, trust me. Will that result in a slightly higher real yield than expected? It’s possible.

Definition: The “real yield” of a TIPS is its yield above official future U.S. inflation, over the term of the TIPS. So a real yield of 1.31% means an investment in this TIPS will exceed U.S. inflation by 1.31% for 10 years. If inflation averages 2.2%, you’d get a nominal return of 3.51%, on par with a nominal 10-year U.S. Treasury, currently 3.49%. But if inflation averages 4.5%, you’d get a nominal return of 5.81%.

Here is the trend in the 10-year real yield over the last 15 years. I am showing the “big picture” here because this span includes two recessionary periods, which resulted in Federal Reserve intervention and eventually deeply lower real yields. Are we at the brink of another recession? If so, how will the Federal Reserve react? How long can real yields sustain at relatively high levels? Lots of questions:

Click on the image for a larger version.

As this graph shows, today’s real yields remain close to a 14-year high. Yes, real yields have fallen off a bit, but remain attractive, in my opinion.

Pricing

Because this will be a new TIPS with a positive real yield, the auction is going to result in an unadjusted price that is less than $100 for $100 of par value. That is because the Treasury will set the coupon rate at 1/8-percentage-point below the auctioned real yield. As I noted above, a real yield of 1.31% would result in a coupon rate of 1.25%. A real yield of 1.4% would result in a coupon rate of 1.375%.

Plus, because the inflation index will be less than 1.0, the adjusted price should also be slightly below $100, but there will also be a small amount of accrued interest, probably about 5 cents per $100.

Add it all together and an investor might pay about $99.60 for about $100 of par value, but will end up with about $99.95 of actual principal at the settlement date. That’s a rough estimate, and things will change by Thursday. The key thing for investors is that the cost of the par value you purchase should be very close to par value. No surprises.

Want to know more about TIPS pricing? Read this.

Inflation breakeven rate

With a 10-year Treasury note closing Friday at 3.49%, this TIPS would have an inflation breakeven rate of 2.18% if the real yield holds at 1.31%. That seems perfectly reasonable. Inflation over the last 10 years has averaged about 2.6%. I would be more willing to gamble on a 10-year TIPS with a real yield of 1.31% versus a 10-year nominal at 3.49%.

Inflation protection at this point in the cycle isn’t very expensive because the market seems to believe the recent surge in inflation has been tamed. But even if that is so — and I doubt it in the medium-term — projecting future inflation at 2.18% seems like an easy target.

Here is the trend in the 10-year inflation breakeven rate over the last 15 years, showing the surge higher in March 2020 in response to post-Covid stimulus and the gradual move lower beginning in March 2022, as the Fed began to respond to surging inflation:

Click on the image for a larger version.

Final thoughts

I have been targeting this TIPS for purchase for several months because I want to fill a 2033 spot in my TIPS ladder. So I will probably be a buyer, even if real yields decline a bit. But how big a purchase? Should I space out my purchases throughout 2023?

There will be six 10-year TIPS opening and reopening auctions in 2023 — this one in January, and then every other month through November. So investors will have many opportunities. But the key concern is how long real yields can remain at historically high levels. They could certainly go higher, but they certainly could move lower if recession looms.

Let’s look back at January 2019, when the Treasury offered a new 10-year TIPS, CUSIP 9128285W6. At the time, just like now, 10-year real yields had been drifting lower as the auction approached. Using all the wisdom I could muster, I wrote:

“A few months ago, I had targeted this new 10-year TIPS as a purchase, in the hopes of a real yield and coupon rate of at least 1.00%. … Yet, I am committed to adding a 10-year TIPS to my bond ladder sometime during 2019. Hopefully, I can find a higher real yield through the year.”

That January 2019 auction ended up getting a real yield of 0.919% and it was the last “great” auction of 2019, as the Fed began cutting interest rates. I didn’t buy in January and ended up buying no other 10-year TIPS in 2019. Here is how 10-year real yields trended through the rest of that year:

Reality check: I don’t think 2023 is likely follow the pattern of 2019, for several reasons: 1) the Fed is much more committed to holding interest rates at high levels, 2) quantitative tightening will continue throughout the year, and 3) global interest rates are also higher, providing competition to U.S. Treasurys. But toss all that out if the economy moves strongly toward recession.

Conclusion. I will be a buyer Thursday, but I’ll be watching conditions before I make the purchase. That’s my view. If you are considering this TIPS, you can track the Treasury estimates of real yield here, updated daily. Reminder: Anything can happen in the days and hours before a TIPS auction, sometimes good, sometimes bad. The bond market is volatile.

Non-competitive bids at TreasuryDirect must be placed by noon Thursday. If you are putting an order in through a brokerage, make sure to place your order Wednesday or very early Thursday, because brokers cut off auction orders before the noon deadline. I’ll be posting results soon after the auction closes at 1 p.m. ET Thursday.

Here’s a history of 9- to 10-year TIPS auctions going back to 2017, a span that includes the end of the Fed’s last tightening cycle in early 2019. I have highlighted the three auctions with real yields above 1%:

* * *

Feel free to post comments or questions below. If it is your first-ever comment, it will have to wait for moderation. After that, your comments will automatically appear.Please stay on topic and avoid political tirades.

David Enna is a financial journalist, not a financial adviser. He is not selling or profiting from any investment discussed. I Bonds and TIPS are not “get rich” investments; they are best used for capital preservation and inflation protection. They can be purchased through the Treasury or other providers without fees, commissions or carrying charges. Please do your own research before investing.

Posted in Inflation, Investing in TIPS | 57 Comments

Is the I Bond’s variable rate heading to zero? Maybe not.

Historical evidence clearly shows non-seasonal inflation lags from October to December, picks up from January to March.

By David Enna, Tipswatch.com

The one really big thing I have learned while writing about inflation and inflation protection over the last 12 years is this: You can’t assume anything about inflation. Years ago, I was perfectly willing to make predictions. Now, after getting spanked by inflation again and again, I just say: “Let’s wait and see.”

Take last year for example: When the June 2022 inflation report was released, the third in the six-month string for setting the I Bond’s variable rate, inflation was running at 3.03%. In just three months! That seemed to indicate — if this trend continued — the new variable rate could rise to 12% at the November reset. Several news reports touted 10% to 12% figures. I cringed.

The trend didn’t continue, and we hit three months of low inflation from July to September, resulting in a perfectly reasonable variable rate of 6.48%.

Now we are three months into a new six-month span that will reset the I Bond’s variable rate on May 1. The trend of seemingly low inflation is continuing and right now we are looking at a variable rate of 0.0%. Could that happen? Yes. Will it happen? Let’s wait and see.

Today, I decided to look at the last 10 years of October to March rate-setting periods for I Bonds, focusing on the ones where inflation started off slowly. And then ask: What was end result after the full six months? Let’s take a look.

2020

From October to December 2020, non-seasonally adjusted inflation ran at just 0.07%, indicating a “trend” toward a variable rate of 0.28%. But then inflation picked up from January to March 2021, and the resulting variable rate was quite a bit higher: 3.54%, annualized.

We saw a similar pattern in the April to September 2020 period, when inflation ran at -0.12% in the first three months, projecting a trend toward a variable rate of -0.48%. But then inflation popped higher, and the annualized variable rate ended up at 1.68%.

2019

From October to December 2019, inflation ran at 0.08%, projecting a trend toward an annualized variable rate of 0.32%. Inflation picked up (a bit) from January to March 2020, resulting in a variable rate of 1.06%.

2018

From October to December 2018, non-seasonally adjusted inflation ran at -0.48%, projecting a trend toward an annualized variable rate of -1.92%. At the time, I wrote this:

This is a fairly disastrous trend for holders of I Bonds, because even though an I Bond’s composite interest rate can’t go below zero, a negative variable rate will wipe out a matching amount of the I Bond’s fixed rate. … Still, this negative trend could reverse, at least partially, in the next three inflation reports.

And yes, the trend did reverse, with the annualized variable rate ending up at 1.4%.

2017

From October to December 2017, inflation ran at -0.12%, projecting the potential for a new variable rate of -0.48%. But then inflation rebounded in January to March 2018, resulting in a variable rate of 2.22%.

2016

Inflation from October to December 2016 ran at 0.0%, just like we are seeing in the last three months of 2022, projecting the potential for a 0.0% variable rate. But inflation rebounded from January to March 2017, resulting in an annualized variable rate of 1.96%.

2015

Non-seasonally adjusted inflation from October to December 2015 ran at -0.60%, projecting a possible trend toward a variable rate of -2.4%. Pretty disastrous, right? But it didn’t happen. Inflation rose enough in January to March 2016 to bring the variable rate up to 0.16%.

2014

Inflation from October to December 2014 ran at -1.35%, projecting a possible trend toward a variable rate of -5.4%. Deflation was bad, but not that bad. Inflation from February and March 2015 rebounded enough to get the variable rate to -1.60%, still a very ugly number.

Since I Bonds were first launched in 1998, there have been only two rate-setting periods resulting in a negative variable rate: This one in 2014, and the October 2008 to March 2009 period, which got a spectacularly low rate of -5.56%.

One oddity of I Bonds is that if you are going to have a negative variable rate, it’s better for it to be deeply negative. That’s because the composite interest rate can’t go below 0.0%, so you won’t lose a cent of principal, and you will be out-performing inflation for those six months. When inflation rebounds higher, you get the full benefit without suffering any penalty for deflation.

Historical perspective: A lesson learned

I could have continued this listing. In 2013, the October to December period ran at -0.47%, but the resulting annualized variable rate was 1.84%. In 2012, the October to December period ran at -0.78%, but the resulting variable rate was 1.18%. That is far back as my compiled data go.

Even if you look at 2021, when inflation was surging, the October to December period ran at 1.63%, projecting a trend toward a possible variable rate of 6.52%. But inflation surged even higher in January to March 2022, resulting in the epic variable rate of 9.62%.

Clearly, since this trend has continued for 10 straight years, non-seasonally adjusted inflation tends to under-report in the October to December period, and then rebound in the January to March period. This was easily seen in the November inflation report, with seasonally-adjusted inflation coming in at 0.1%, but non-seasonal at -0.1%. And then for December, seasonally-adjusted was -0.1%, while non-seasonal was -0.31%. Seasonal and non-seasonal balance out over 12 months, so we should see some gains in non-seasonal inflation in the months ahead.

So back to the question: Will the I Bond’s variable rate go to zero at the May 1 reset? Based on this historical evidence, I don’t think it will. It will be higher that 0.0%. But anything can happen. Let’s wait and see.

I Bonds: A not-so-simple buying guide for 2023

Confused by I Bonds? Read my Q&A on I Bonds

Let’s ‘try’ to clarify how an I Bond’s interest is calculated

Inflation and I Bonds: Track the variable rate changes

I Bond Manifesto: How this investment can work as an emergency fund

* * *

Feel free to post comments or questions below. If it is your first-ever comment, it will have to wait for moderation. After that, your comments will automatically appear.Please stay on topic and avoid political tirades.

David Enna is a financial journalist, not a financial adviser. He is not selling or profiting from any investment discussed. The investments he discusses can be purchased through the Treasury or other providers without fees, commissions or carrying charges. Please do your own research before investing.

Posted in I Bond, Inflation, Savings Bond | 34 Comments

U.S. inflation fell 0.1% in December; a sign of things to come?

Data for three months indicate the I Bond’s variable rate could fall to 0.0%. What does it mean for investors?

By David Enna, Tipswatch.com

U.S. inflation transitioned to deflation in December, with the all-items Consumer Price Index for All Urban Consumers falling 0.1% for the month, after increasing just 0.1% in November, the Bureau of Labor Statistics reported today. Inflation for the year 2022 ended at 6.5%, falling below 2021’s 7.0%.

All-items inflation was below the consensus estimates of 0.0% for the month and 6.6% for the year, but more recent projections cited -0.1% for the month. Core inflation, which removes food and energy, ran at 0.3% for the month and 5.7% for the year, matching expectations.

So these numbers aren’t really much of a surprise. Expectations of easing inflation had sent the U.S. stock market surging higher — and Treasury yields falling — over the last two weeks. The S&P futures were up just slightly at 9 a.m., indicating a lack of euphoria (at least so far).

The BLS noted that gasoline prices, which fell 1.5% in the month, were the largest factor in the all-items index moving negative. Gasoline prices are now up just 0.4% year over year. More items from the report:

  • Food at home prices were up 0.2% for the month and 11.8% for the year. The index for meats, poultry, fish, and eggs increased 1.0% in December, but costs of fruits and vegetables fell 0.6%.
  • Shelter costs rose 0.8% for the month and were up 7.5% for the year. Shelter tends to be a lagging index, with leases rolling over gradually. Rents were up 0.8% for the month.
  • Apparel costs rose 0.5% for the month but were up just 2.9% for the year.
  • Costs for used cars and trucks fell 2.5% for in December, the sixth consecutive month of declines. New vehicle prices also fell by 0.1%.
  • The index for medical care services rose 0.1% for the month, after declining the two previous months.

This report presents positive news on U.S. inflation, but a lot of the December decline was due to falling gasoline prices. Food prices also moderated. Both of those factors are welcome for U.S. consumers. Shelter costs continued moving higher, but that was expected with higher rent costs rolling into effect. Clearly, U.S. housing prices are at least at a standstill with mortgage rates nearly doubling over the last year.

This disinflationary trend could continue for several months, because last year’s CPI numbers were quite high from January to June, making month-to-month baseline numbers hard to exceed. Even if monthly numbers rise, annual inflation should be declining in the first half of 2023. After June, inflation could pick up again, but that’s a long way off:

Here is the one-year trend for both all-items and core inflation over the last year, showing the dramatic fall in all-items inflation since June, and more recently the gradual fall in core inflation:

What this means for TIPS and I Bonds

Investors in Treasury Inflation-Protected Securities and U.S. Series I Savings Bonds are also interested in non-seasonally adjusted inflation, which is used to adjust principal balances on TIPS and set future interest rates for I Bonds. For December, the BLS set the CPI-U index at 296.797, a decline of 0.31% from the November number. Over the last year, non-seasonally adjusted inflation has increased 6.45%.

For TIPS. The December inflation report means that principal balances for all TIPS will fall 0.31% in February, following a decline of 0.10% in January. But over the last year, ending in February, principal balances will be up 6.45%.

Take for example CUSIP 912828WU0, a TIPS that matures July 15, 2024. Its inflation index will start the month of February at 1.25381 and end the month at 1.25009. This isn’t great news, but it is how TIPS work, tracking official U.S. inflation. Here are the new February Inflation Indexes for all TIPS.

For I Bonds. The December report is the third in a six-month series that will set the I Bond’s new inflation-adjusted variable rate. The reset will be on May 1 for I Bonds purchased from May to October 2023, but eventually will roll into effect for all I Bonds. Through December, inflation has run at 0.00%, meaning the I Bond’s new variable rate would be 0.00%, down dramatically from the current 6.48%. Here are the numbers:

Three months remain, and a lot can happen in three months. But as I noted earlier, the very high baseline numbers from 2022 indicate that disinflation, or deflation, could continue through June. But those baseline numbers really only effect the annual rate; the month-to-month inflation rate could move higher from January to March, but we are still likely to see a lower variable rate at the May reset.

For regular I Bond investors, this points to purchasing your 2023 I Bond allocation — $10,000 per person per calendar year — before May 1 to lock in the current 6.89% for six months, which includes the fixed rate of 0.4%. For short-term I Bond investors who bought in 2022, the next variable rate could give you an exit window with a very low three-month interest penalty.

See my recent post: I Bonds: A not-so-simple buying guide for 2023

And also: Short-term I Bond investors: Be patient with your exit strategy

If this disinflationary trend continues for several months, investor interest in I Bonds and TIPS is likely to wane. In fact, short-term investors should probably look at attractive nominal investments like a 1-year Treasury bill at 4.73%. But clearly we can’t be certain that the inflationary monster has been tamed in the long run.

What this means for future interest rates

The Federal Reserve seems highly committed to raising short-term interest rates by 25 basis points in early February, pushing the federal funds rate to 4.50% to 4.75%. Could that be the last rate increase? More likely, the second-to-last rate increase?

This morning’s Bloomberg report has this headline: “US Inflation Cools Again, Putting Fed on Track to Downshift“. Plus, rather comically, “Stocks Drop as In-Line CPI Fails to Sustain Rally“.

I have been theorizing that the Federal Reserve has been issuing hawkish public statements over the last month to try to cool market fervor over a stall — and then potential cuts — in interest rates. The bond market, though, hasn’t been listening, with mid- and long-term nominal and real yields falling in recent weeks.

I think we are nearing the end of this rate-hiking cycle. But the Fed has to continue to slash its massive holdings of U.S. Treasurys, and that roll-off or even sell-off should elevate bond yields, eventually. The unknown factor is the health of the U.S. economy and job market. If a recession hits with a vengeance, the Fed will back off, quickly and somewhat aggressively.

I Bonds: A not-so-simple buying guide for 2023

Confused by I Bonds? Read my Q&A on I Bonds

Let’s ‘try’ to clarify how an I Bond’s interest is calculated

Inflation and I Bonds: Track the variable rate changes

Confused by TIPS? Read my Q&A on TIPS

TIPS in depth: Understand the language

Upcoming schedule of TIPS auctions

* * *

Feel free to post comments or questions below. If it is your first-ever comment, it will have to wait for moderation. After that, your comments will automatically appear.Please stay on topic and avoid political tirades.

David Enna is a financial journalist, not a financial adviser. He is not selling or profiting from any investment discussed. The investments he discusses can be purchased through the Treasury or other providers without fees, commissions or carrying charges. Please do your own research before investing.

Posted in Federal Reserve, I Bond, Inflation, Investing in TIPS | 20 Comments

Barron’s Live: Best Timing for I Bonds

Tipswatch.com

I participated Monday in a Barron’s Live 30-minute video podcast, hosted by Marketwatch columnist Beth Pinsker. The topic was strategies for buying Series I Savings Bonds in 2023. In January? In April? In May? Or just go with TIPS?

You can watch the video here (requires registration on the Barron’s site).

Or listen to the audio podcast on these links:

About this podcast

I Bonds, a once-obscure Treasury investment, soared in popularity last year because of its enticing inflation-adjusted rate that changes every six months, but individuals are limited by a $10,000 cap on purchases per year. Now that we’re in a new year, there are three key strategies to make the most of your investment. Join Beth Pinsker, investing columnist for MarketWatch and long-time journalist David Enna.

I Bonds: A not-so-simple buying guide for 2023

Confused by I Bonds? Read my Q&A on I Bonds

Let’s ‘try’ to clarify how an I Bond’s interest is calculated

Inflation and I Bonds: Track the variable rate changes

I Bond Manifesto: How this investment can work as an emergency fund

Posted in I Bond, Investing in TIPS, TreasuryDirect | 14 Comments