
By David Enna, Tipswatch.com
This article is the seventh in a series looking at how my three favorite bond funds — Vanguard Short-Term Inflation Protected (VTIP), Schwab U.S. TIPS (SCHP) and Vanguard’s Total Bond (BND) — performed after 2013, when the Fed signaled it would back off on bond purchases and eventually raise short-term interest rates.
Why do this? Because we may be heading into a similar scenario in 2022 and beyond, with the Fed tapering bond purchases and eventually (and gradually) raising short-term interest rates. The performance after 2013 could tell us a lot about what’s ahead.
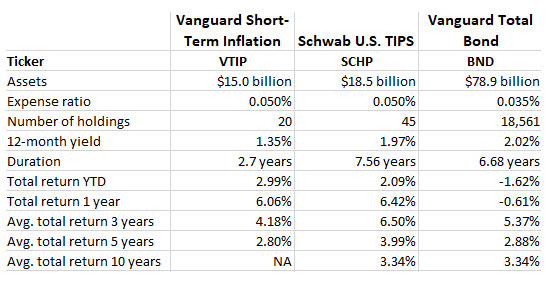
To recap, here are the three bond funds I am tracking; they are three conservative, liquid, mainstream bond funds with very low expense ratios. Here’s a summary of their basic statistics and performance:
2019: The Fed cries ‘uncle’; bond investors celebrate
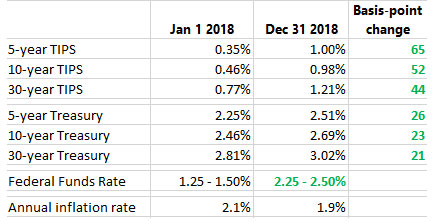
Something significant happened at the end of 2018: After the Federal Reserve raised short-term interest rates in December — for the fourth time that year — stock market investors threw a fit, with the S&P 500 plunging nearly 15% in the first three weeks of December. The Federal Reserve got the message: It was time to change course.
During years of stock market gains from 2013 through 2016, the Fed had acted slowly to raise short-term interest rates from a near-zero level, by 25 basis points in 2015 and and another 25 in 2016. This was after S&P 500’s total return gained 32.2% in 2013, 13.5% in 2014, 1.3% in 2015, and 12% in 2016. But in 2018, the stock market had a negative return, with the S&P’s total return falling by 4.6%. That is the only year in the 2013 to 2021 period that the stock market had a negative return.
So, what did the Federal Reserve do? Here are its actions to reduce its federal funds rate in 2019:
- July 31, 2019: Reduction of 25 basis points, to a range of 2.00 – 2.25%.
- Sept. 18, 2019: Reduction of 25 basis points, to a range of 1.75 to 2.00%
- Oct. 30, 2019: Reduction of 25 basis points, to a range of 150 to 1.75%
In addition, the Federal Reserve announced in October 2019 that it would relaunch “pseudo” quantitative easing, with plans to buy $60 billion of Treasury bills per month. The Fed claimed this wasn’t QE, but an attempt to add short-term liquidity to the market. “These operations have no material implications for the stance of monetary policy,” the Fed said in a statement.
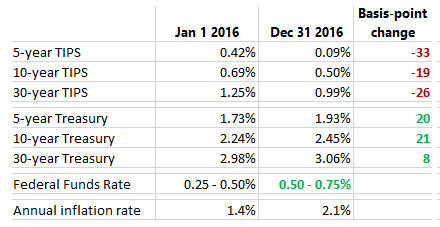
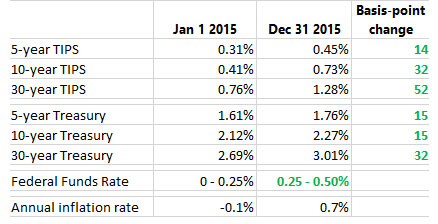
And here is how the bond market reacted, with both real and nominal yields falling across all maturities:
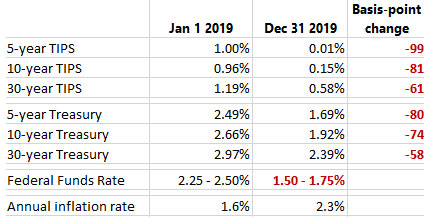
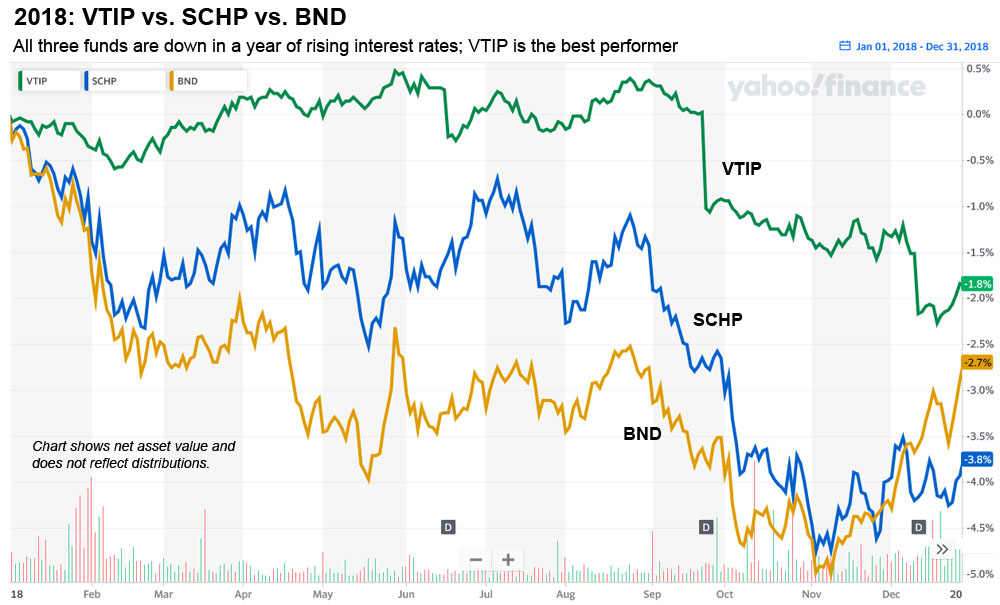
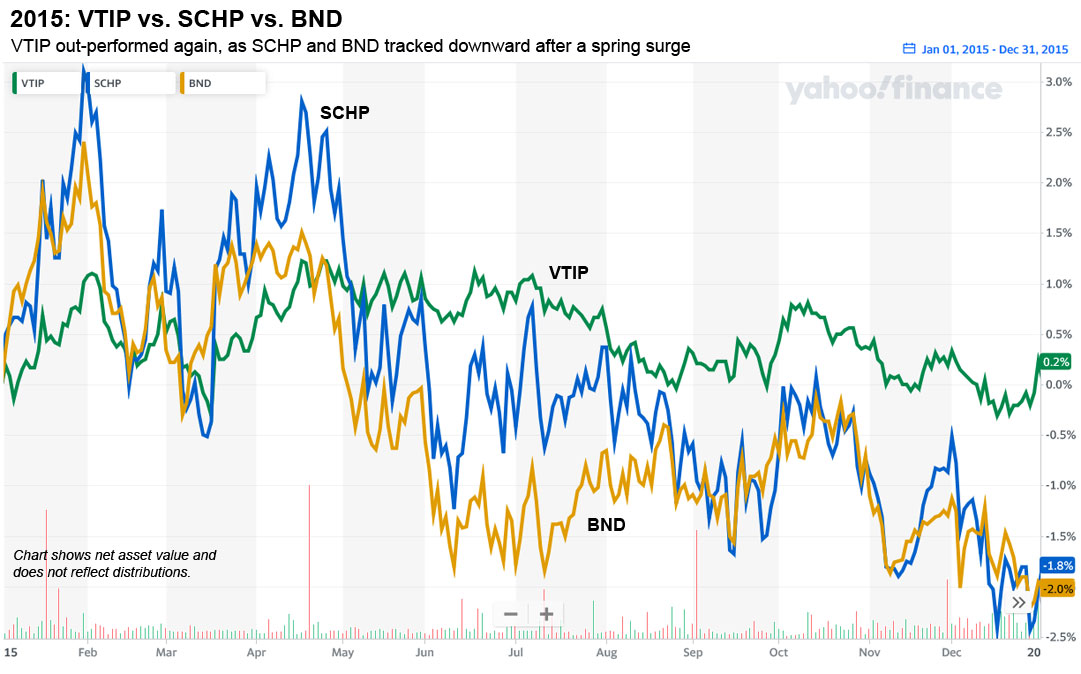
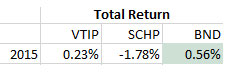
The year 2019 set up a very good scenario for TIPS investors: Real yields were falling deeply, while inflation maintained at a brisk level of 2.3% for the year. That combination gives TIPS investors capital gains, combined with gains in inflation accruals. The overall bond market also benefited from fairly deep declines in nominal rates. Here is how the net asset value of our three funds performed 2019, not including distributions:
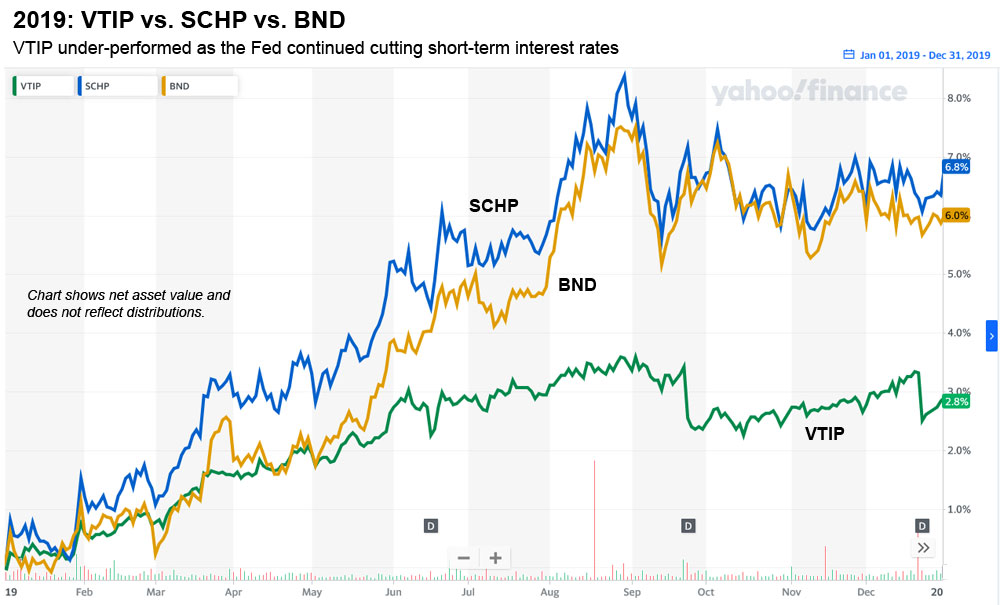
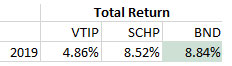
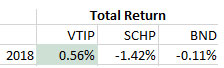
Vanguard’s short-term TIPS fund, VTIP, with its shorter duration, was the laggard in this group, but it still had a good one-year performance. When distributions are added in Vanguard’s total bond ETF, BND, was the best performer of the three, just edging out Schwab’s U.S. TIPS ETF.
All of that looks fantastic — and it is fantastic — except when you look at the total return of the S&P 500 in 2019, up a glorious 31.2%, easily overwhelming its paltry 4.6% decline in 2018. The Federal Reserve heard the stock market’s bellows of pain in December 2018, and responded with three cuts in short-term interest rates. The “easy money” game was on again.
Conclusion
It’s odd, but my memory of 2019 was that the U.S. economy was heading toward recession and the Federal Reserve was working feverishly to avoid that, slashing interest rates and launching some sort of Treasury-bill QE. But, in reality … inflation ran at an above-target 2.3% for the year, and U.S. GDP grew 2.2% for the year, a reasonable rate. The U.S. stock market had a total return of 31%. The bond market cranked out gains of nearly 9%. And all this happened while the Federal Reserve was easing monetary policy.
This was all very weird. Except … nowhere near as weird as what was coming in 2020.
Coming Tuesday: The June inflation report
Coming Wednesday: A look back at 2020
- 2013: A year of surging real and nominal yields
- 2014: The deck was stacked against TIPS funds
- 2015: The Fed actually did something!
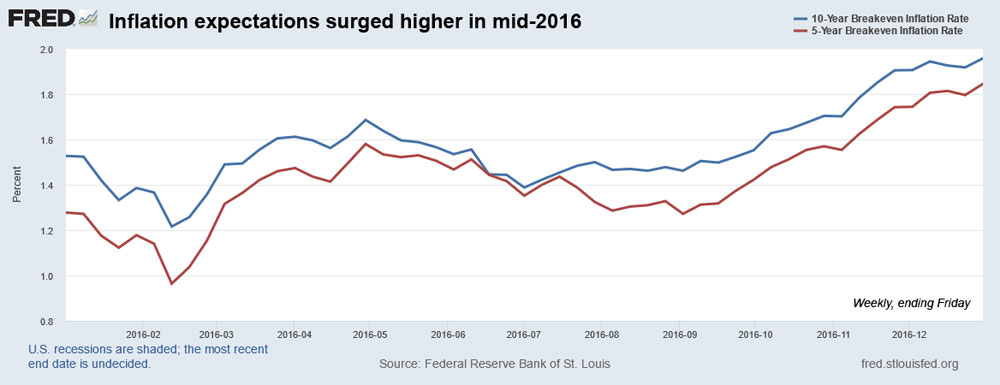
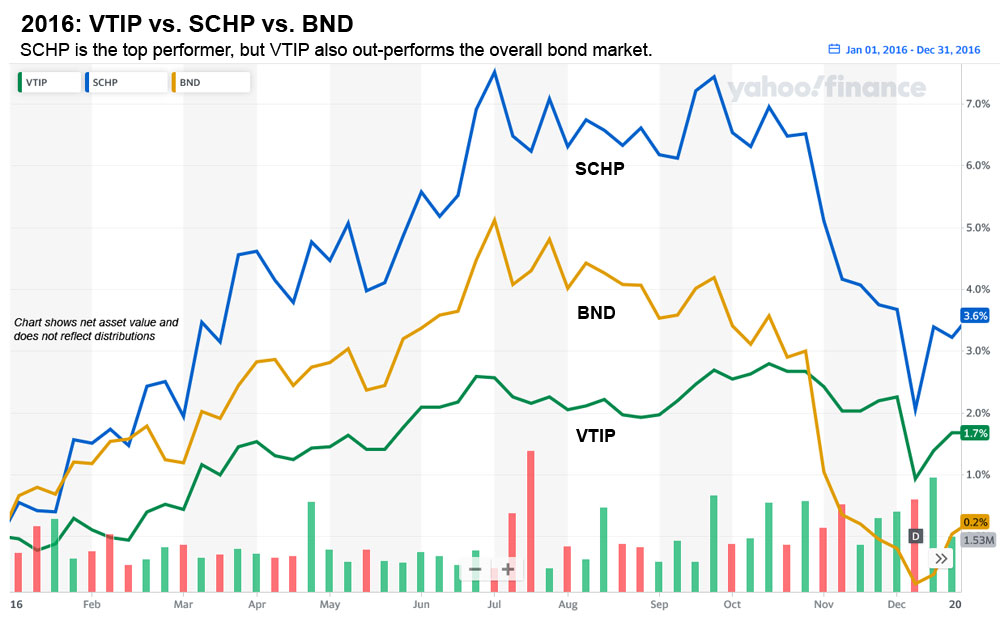
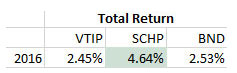
- 2016: Inflation rises; TIPS out-perform the overall bond market
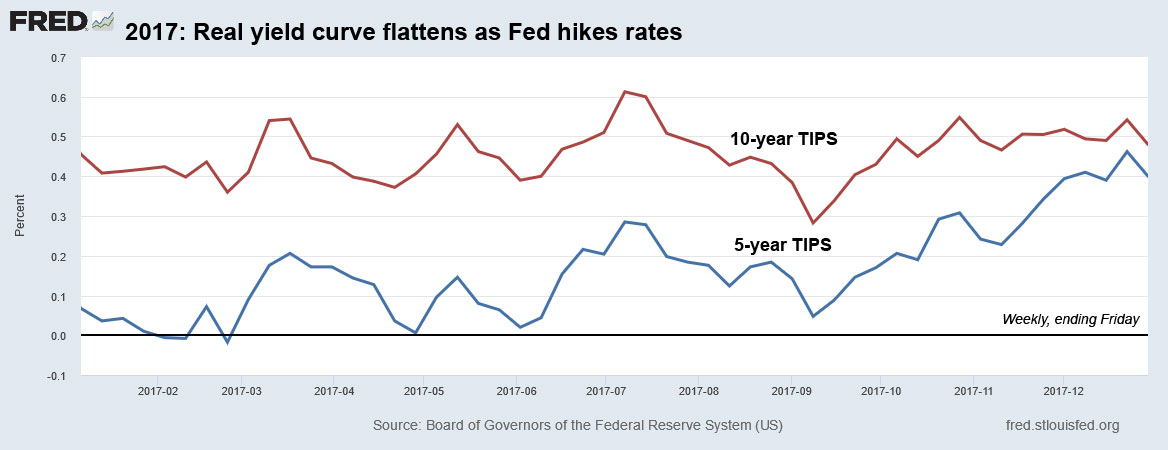
- 2017: ‘The calm before the storm’
- 2018: Did the Federal Reserve go too far?
- 2020: Chaotic year of pandemic fears, stunning stimulus
- 2021 and beyond: What’s ahead for U.S. financial markets?
* * *
David Enna is a financial journalist, not a financial adviser. He is not selling or profiting from any investment discussed. The investments he discusses can purchased through the Treasury or other providers without fees, commissions or carrying charges. Please do your own research before investing.

I selfishly request you add the 20-year TIPS to the list.