
Treasury also maintains EE Bond’s doubling period at 20 years
By David Enna, Tipswatch.com
The U.S. Treasury just announced the November 2021 to April 2022 terms for U.S. Series I Bonds and EE Bonds, and there were no surprises. Both of these Savings Bonds remain exceptional investments in our current low-interest-rate market.
I Bonds
Here are details from the Treasury’s announcement:
“The composite rate for Series I Savings Bonds is a combination of a fixed rate, which applies for the 30-year life of the bond, and the semiannual inflation rate. The 7.12% composite rate for I bonds bought from November 2021 through April 2022 applies for the first six months after the issue date. The composite rate combines a 0.00% fixed rate of return with the 7.12% annualized rate of inflation as measured by the Consumer Price Index for all Urban Consumers (CPI-U). The CPI-U increased from 264.877 in March 2021 to 274.310 in September 2021, a six-month change of 3.56%.”
Here is my translation:
- An I Bond earns interest based on combining a fixed rate and a semi-annual inflation rate. The fixed rate – which will continue at 0.0% – will never change. So I Bonds purchased from Nov, 1, 2021, to April 30, 2022, will carry a fixed rate of 0.0% through the 30-year potential life of the bond.
- The inflation-adjusted rate (also called the variable rate) changes every six months to reflect the running rate of non-seasonally adjusted inflation. That rate is now set at 7.12% annualized. It will update again on May 1, 2022, based on U.S. inflation from September 2021 to March 2022.
- The combination of the fixed rate and inflation-adjusted rate creates the I Bonds’ composite interest rate, which was 3.54% but now rises to 7.12%. An I Bond bought today will earn 7.12% (annualized) for six months and then get a new composite rate every six months for its 30-year term.
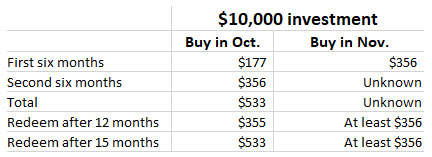
It’s important to note, however, that all I Bonds — no matter when they were issued — will get that 7.12% inflation-adjusted rate for six months, on top of any existing fixed rate. So an I Bond purchased in October will receive 3.54% for six months, and then 7.12% for six months. I Bonds purchased back in September 1998 (with a fixed rate of 3.4%), will receive a composite rate of 10.64% for six months.
Here is the formula the Treasury used to determine the I Bond’s new composite rate:
| The composite rate for I bonds issued from November 2021 through April 2022 is 7.12% | |
|---|---|
| Here’s how the Treasury set that composite rate: | |
| Fixed rate | 0.00% |
| Semiannual inflation rate | 3.56% |
| Composite rate = [fixed rate + (2 x semiannual inflation rate) + (fixed rate x semiannual inflation rate)] | [0.0000 + (2 x 0.0356) + (0.0000 x 0.0356)] |
| Composite rate | [0.0000 + 0.0712 + 0.0000000] |
| Composite rate | 0.0712000 |
| Composite rate | 0.0712 |
| Composite rate | 7.12% |
None of this was a surprise, but the new terms do mean I Bonds remain a very attractive investment, earning at least 3.56% over the next year, and probably much higher. That compares to 0.15% for a 1-year Treasury and maybe 0.60% for a best-in-nation 1-year bank CD. In other words, in a worst-case scenario I Bonds will return close to six times the earnings of the next-best very safe investment. The actual return will likely be higher than 5% over the next 12 months.
(An I Bond has to be held one year before it can be redeemed, but an investor can purchase the I Bond near the end of a month and get full credit for the month. That means an I Bond can be, effectively, an 11-month investment. I Bonds redeemed from 1 to 5 years face a penalty of three months interest; after 5 years there is no penalty.)
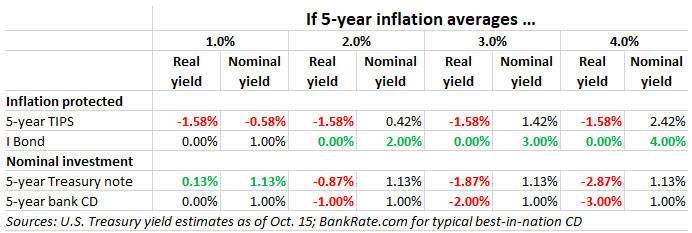
The fixed rate of an I Bond is equivalent to the “real yield” of a Treasury Inflation-Protected Security. It tells you how much the I Bond will yield above the official U.S. inflation rate. Right now, an I Bond will exactly match U.S. inflation. Because the Treasury held the I Bond’s fixed rate at 0.0%, it will track official U.S. inflation, but not exceed it, except after a period of extended deflation.
I Bonds carry a purchase limit of $10,000 per person per year, and must be purchased electronically at TreasuryDirect. Investors also have the option of receiving up to $5,000 in paper I Bonds in lieu of a federal tax refund. Learn more about I Bonds in the I Bonds Manifesto.
EE Bonds
Here are the Treasury’s terms announced Monday:
“Series EE bonds issued from November 2021 through April 2022 earn today’s announced rate of 0.10%. All Series EE bonds issued since May 2005 earn a fixed rate in the first 20 years after issue. At 20 years, the bonds will be worth at least two times their purchase price. The bonds will continue to earn interest at their original fixed rate for an additional 10 years unless new terms and conditions are announced before the final 10-year period begins.”
And here is my translation:
- The EE Bonds’ fixed rate remains at 0.1%, where it has been since November 2015. Awful, right? (Check out your current money market savings rate, somewhere around 0.05%, or less.) But the EE Bonds’ fixed rate is irrelevant because…
- An EE Bond held for 20 years immediately doubles in value, creating an investment with a compounded return of 3.5%, tax-deferred. So, if you invest $10,000 at age 40, you can collect $20,000 at age 60, with $10,000 of that total becoming taxable.
- After the doubling in value at 20 years, the EE Bond reverts to earning 0.1% for another 10 years.
Retaining this 20-year doubling is a big deal. The Treasury has changed this holding period several times in the past, so there was a possibility the terms could change in 2021, with the 20-year nominal Treasury currently yielding 1.98%, well below the EE Bond’s potential of 3.5%.
What this means: You should only invest in EE Bonds if you are absolutely certain you can hold them for 20 years. (And after 20 years they should be immediately redeemed.) They are an ideal “bridge” investment for someone around age 40, who can build an annual stream of income starting at age 60, potentially delaying Social Security benefits until age 70.
The EE Bond will also outperform an I Bond if inflation averages less than 3.5% a year over the next 20 years. I think that is a reasonable possibility (but who knows, given current inflation trends). For anyone with a secure 20-year timeline for investment, an EE Bond remains very attractive.
I Bonds vs. EE Bonds
I Bonds are the talk of the financial world right how, sporting a gaudy 7.12% annual return for six months. No one is talking about EE Bonds, which the financial media typically report as returning 0.1% without ever mentioning the doubling in value over 20 years.
EE Bonds remain a solid, very safe investment for someone who can hold them for 20 years. Their effective yield of 3.5% over 20 years is 157 basis points higher than the yield of a 20-year nominal Treasury. That is huge, and equivalent to about 30% of extra value over a 20-year Treasury bond.
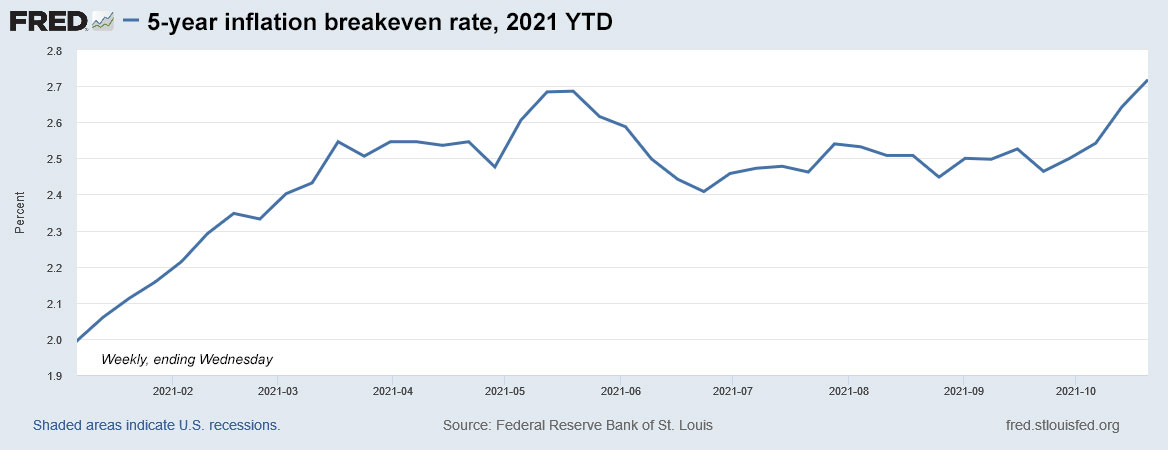
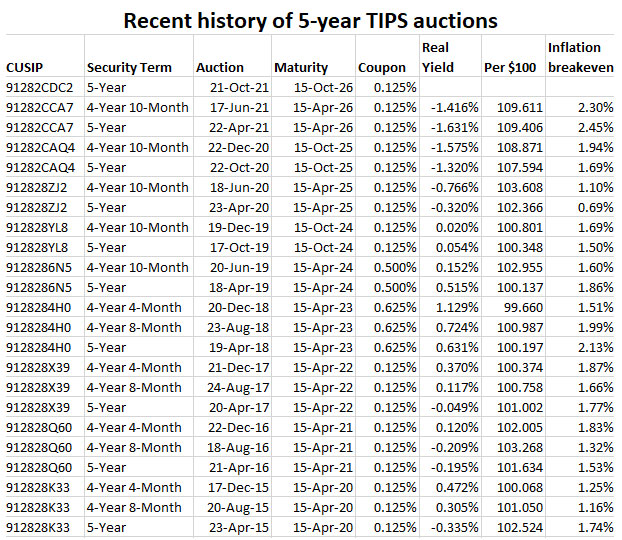
I Bonds are the most attractive, very safe inflation-protected investment in the world. The real yield of an I Bond is 171 basis points better than the real yield of a 5-year TIPS. When it comes to inflation protection, there is no contest.
A combination of I Bonds and EE Bonds also makes sense, providing both inflation protection and strong deflation protection. But EE Bonds only make sense for an investor committed to holding them for 20 years.
* * *
Feel free to post comments or questions below. If it is your first-ever comment, it will have to wait for moderation. After that, your comments will automatically appear.
David Enna is a financial journalist, not a financial adviser. He is not selling or profiting from any investment discussed. The investments he discusses can purchased through the Treasury or other providers without fees, commissions or carrying charges. Please do your own research before investing.


I'm already familiar with the product and was curious if Tipswatch had ever done any rate predictions for it, like…