U.S. inflation increased 0.3% in August, under the consensus estimate.
At this point, the Social Security COLA will increase 5.8% for payments in January, but one month of data remains.
The I Bond’s new inflation-adjusted variable rate is on track to increase to 6.56%, annualized, for six months. One month of data remains.
By David Enna, Tipswatch.com
U.S inflation slipped slightly under consensus estimates in September, but remains at a brisk pace throughout the economy.
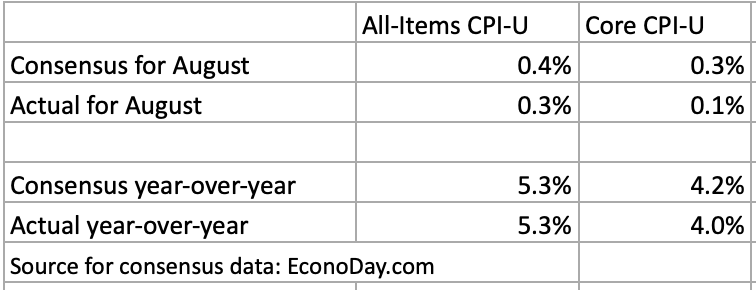
The Consumer Price Index for All Urban Consumers (CPI-U) increased 0.3% in August on a seasonally adjusted basis, the U.S. Bureau of Labor Statistics reported today. Over the last 12 months, the all items index increased 5.3%. The monthly number fell just short of the consensus estimate of 0.4%, but the year-over-year number matched the consensus.
Core inflation, which removes food and energy, increased only 0.1% in August, the BLS reported. That was below the consensus estimate of 0.3%. This was the smallest monthly increase for core inflation since February 2021. Year-over-year core inflation came in at 4.0% for the month, also below the consensus.
The August report shows that inflation continues at a brisk pace across many sectors of the U.S. economy. For example, gasoline prices rose 2.8% for the month, and are up 42.7% over the last year. Some other examples:
Food prices increased 0.4% for the month and are up 3.7% year over year. The BLS said the index for meats, poultry, fish, and eggs rose 0.7% over the month, which won’t surprise grocery shoppers.
Shelter costs increased 0.2% for the month and are up 2.8% for the year.
The costs of medical care services were up 0.3%, but are up only 1.0% for the year.
The index for used cars and trucks fell 1.5%, but is still up 31.9% year over year.
The cost of new vehicles rose a sharp 1.2% for the month, and is up 7.6% for the year.
The index for transportation services fell a sharp 2.3%. One reason: The index for airline fares fell 9.1% over the month.
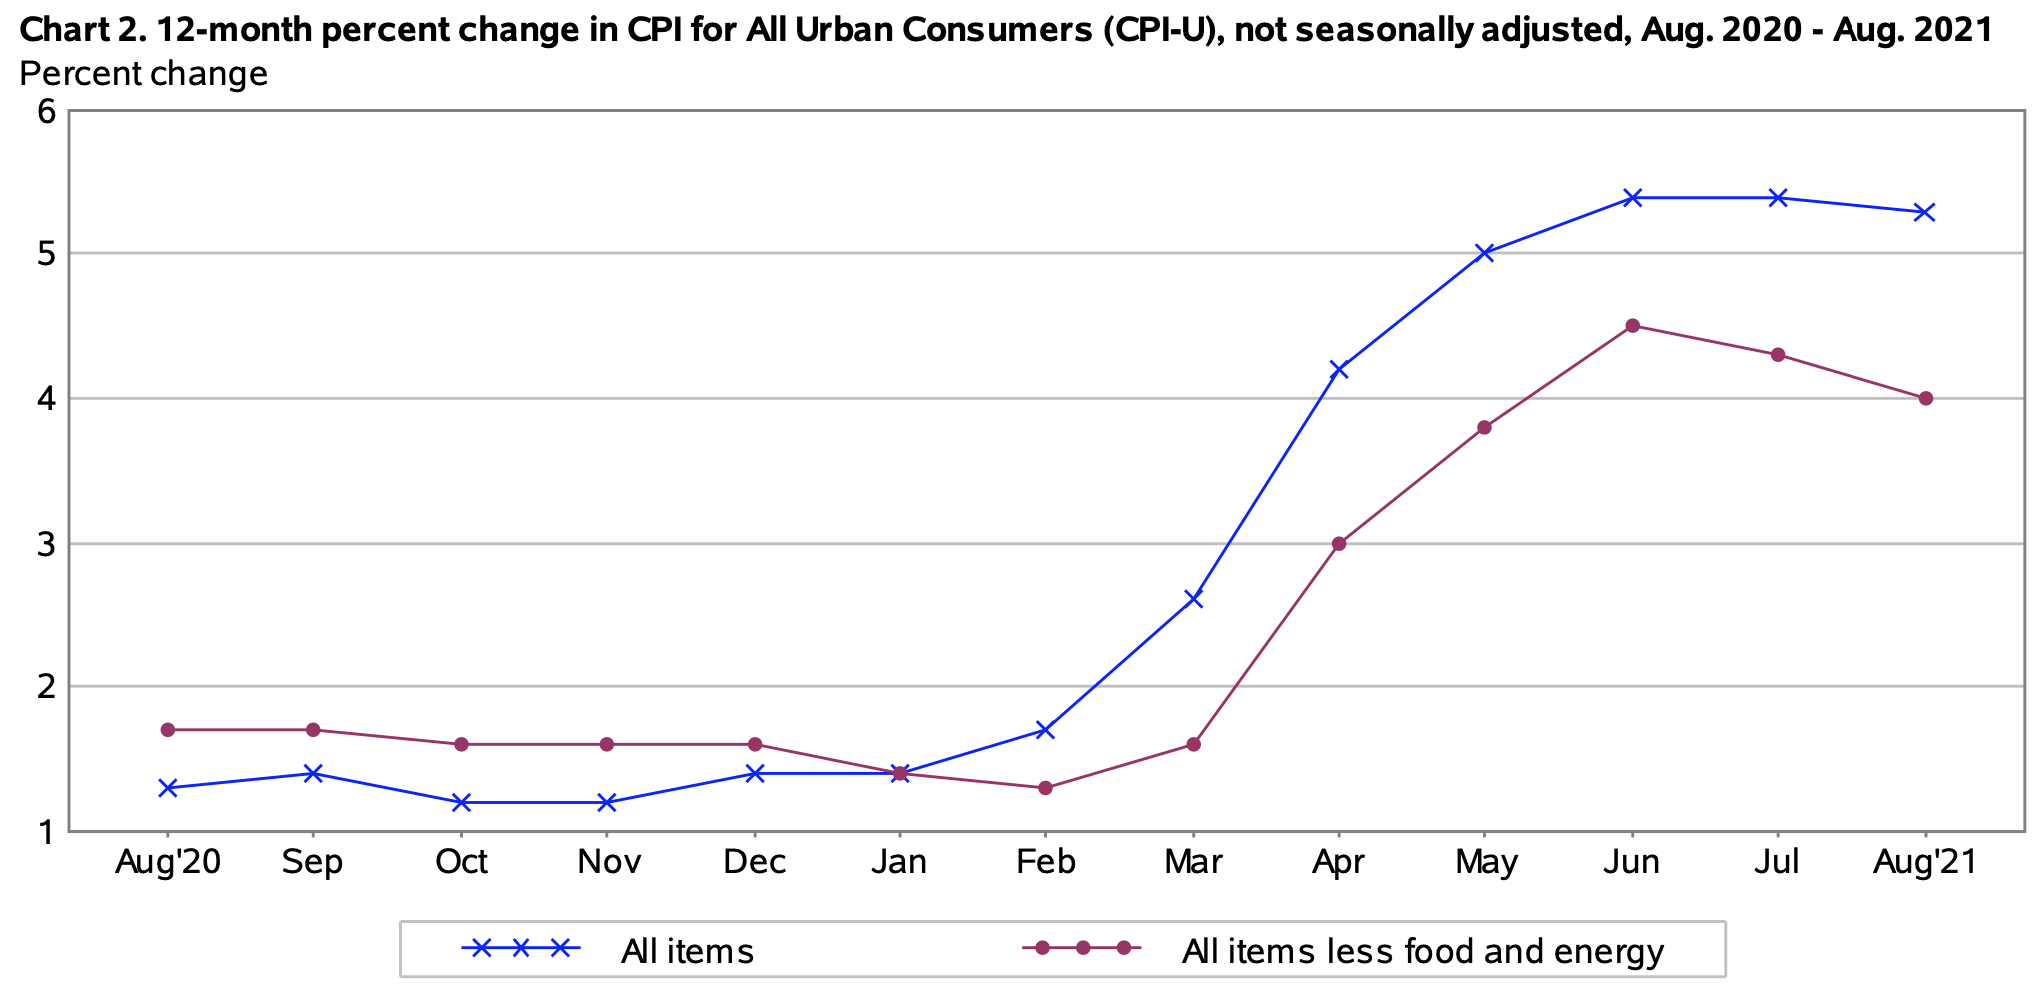
Here is the 12-month trend for both all-items and core inflation over the last 12 months, showing that U.S. inflation seems to be stabilizing at a fairly high level:
What this means for the Social Security COLA
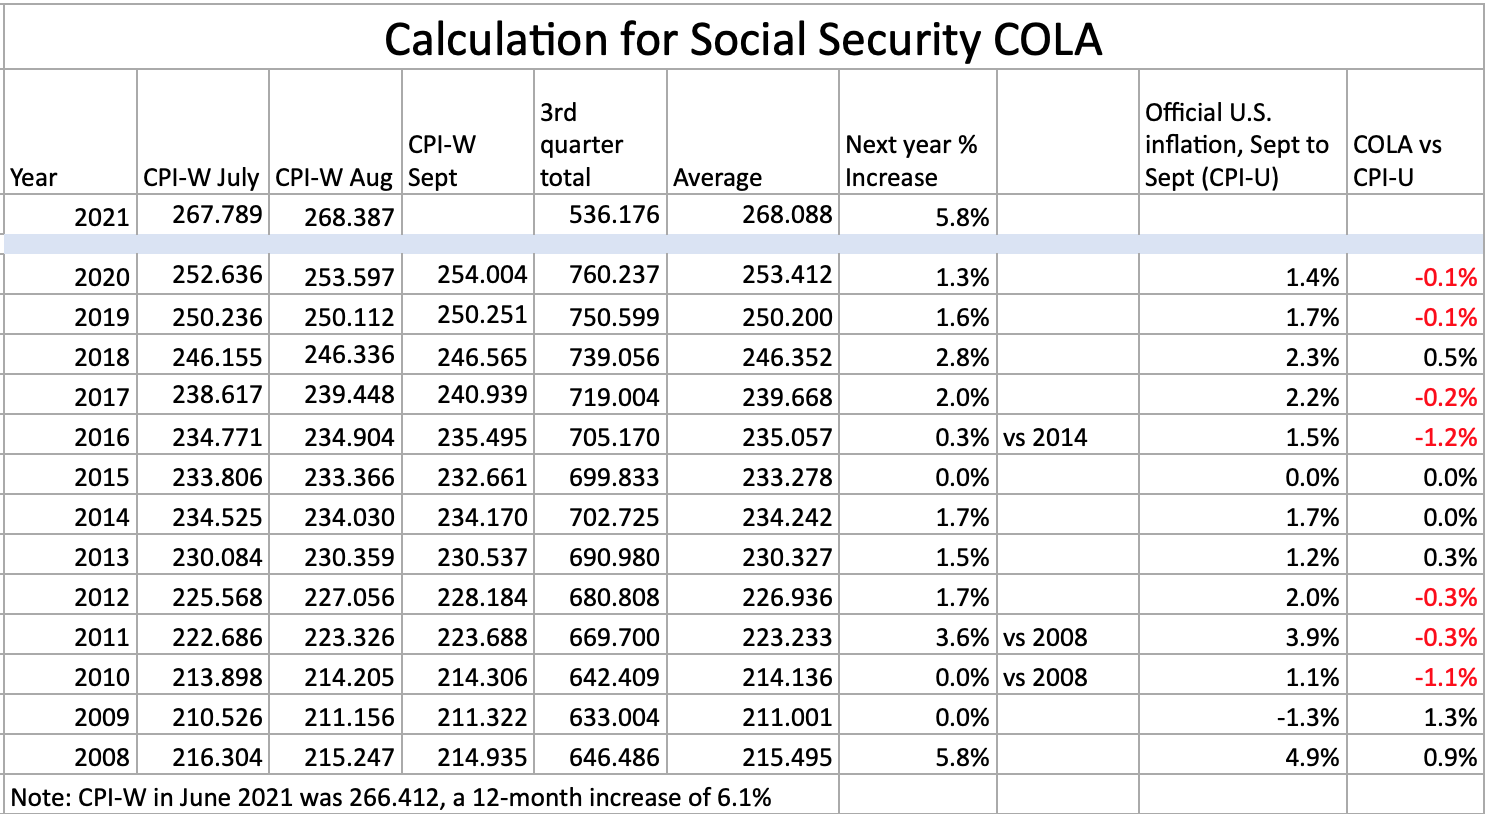
The August inflation report is the second of three — for July to September — that will set the Social Security Administration’s cost of living adjustment for 2022. The SSA uses a three-month average of a different index, the Consumer Price Index for Urban Wage Earners and Clerical Workers (CPI-W), to set its COLA.
For August, the BLS set CPI-W at 268.387, an increase of 5.8% over the last 12 months. But remember, it will be the average of July to September inflation indexes — compared to the same three-month average a year ago — that will determine the Social Security COLA. In a recent article, I had predicted a COLA increase in the range of 5.8% to 6.2%.
At this point, the data are pointing to a 5.8% increase in the Social Security COLA, but that will rise if inflation continues to surge in September. Here are the numbers so far, with one month remaining:
What this means for TIPS and I Bonds
Investors in Treasury Inflation-Protected Securities and U.S. Series I Savings Bonds are also interested in non-seasonally adjusted inflation, which is used to adjust principal balances on TIPS and set future interest rates for I Bonds. For August, the BLS set the CPI-U inflation index at 273.567, an increase of 0.21% over the July number.
For I Bonds. The August inflation report is the fifth in a six-month string that will determine the new inflation-adjusted variable rate for all I Bonds, to be reset on Nov. 1. At this point, with one month remaining, U.S. inflation has been running at 3.28%, which would translate to a new variable rate of 6.56%, annualized, for six months.
I Bonds are suddenly getting a lot of investor attention, and rightly so with a six-month annualized yield of 6.5% on the horizon. But the biggest benefits will go to those investors committed to purchasing I Bonds every year up to the $10,000 per person per year cap. Newcomers can also benefit: I Bonds purchased before Oct. 31 are likely to have a 12-month return of around 5.0%, 10 times the yield of best-in-nation insured savings accounts.
You can find a lot more information on I Bonds on my “Inflation and I Bonds” page, where I track all the monthly inflation updates and provide a primer on I Bonds. Also, read The I Bond Manifesto, which makes the case for including I Bonds in your emergency fund.
For TIPS. The August inflation report means that principal balances for all TIPS will increase 0.21% in October, ending a seven-month string of increases higher that 0.40%. Here are the new October inflation indexes for all TIPS.
What this means for future interest rates
Today’s inflation report — which came in lower than consensus estimates after months of upside surprises — probably gives the Federal Reserve some breathing room. I think the Fed will continue with its plans to gradually taper down its $80 billion a month in Treasury purchases, but the pressure is off (for a month, at least). A very gradual program of tapering should cause longer-term Treasury yields to rise a bit, but not dramatically, off the currently very low levels.
Any increase in short-term interest rates looks to be 12 to 18 months away.
This morning’s Wall Street Journal headline sums things up well: “Inflation Eased in August, Though Still High.” From that report:
Laura Rosner-Warburton, senior economist at MacroPolicy Perspectives, anticipates the emergence of longer-term price pressures in coming months.
The August CPI report “might be a little bit of a headfake, honestly,” suggesting that the recent inflation surge is proving to be transitory, as economists have predicted, “but other factors might be moving under the surface,” said Ms. Rosner-Warburton.
Inflation continues to run well above the Federal Reserve’s target of 2.0% — or is it really 2.5%? — a year. If this surge in inflation is transitory, the Fed can take its time making repairs. But if it isn’t, actions will be needed. We’ll see in future months.
* * *
Note: I am on the road this week and I’m writing this without my usual setup for calculations and images. Forgive any rough edges and let me know if you see errors.
David Enna is a financial journalist, not a financial adviser. He is not selling or profiting from any investment discussed. The investments he discusses can purchased through the Treasury or other providers without fees, commissions or carrying charges. Please do your own research before investing.
In the strange world of 2021, I Bonds are the clear winner.
By David Enna, Tipswatch.com
A few years ago I met three college friends for a day of hiking in northern Illinois (yes, you can hike in northern Illinois; just check out Starved Rock State Park.) When we sat down for lunch in the park’s beautiful lodge, we got to talking about things we were doing for fun or profit.
“I’ve been writing about inflation-protected investments,” I said.
Blank stares.
“It’s something I’ve been interested in for a long time, so I began writing about it,” I said. “Trying to build up a following.”
Blank stares.
“You’ve never heard of Treasury Inflation-Protected Securities or I Bonds?”
My friends shook their heads. Then, one of them said: “Is this some sort of scam?”
My friends are college-educated and very intelligent. In that moment, I realized that most people – maybe 95% of Americans – have no idea what inflation-protected investments are or how they could fit into a portfolio.
What are inflation-protected investments?
The only two inflation-protected investments I follow or care about are both issued by the U.S. government: Treasury Inflation-Protected Securities and Series I U.S. Savings Bonds, also called I Bonds. Both can be purchased directly from TreasuryDirect.gov without fees or commissions. Both can be considered among the safest investments on Earth, fully backed by the U.S. government. So, let’s take a deeper look at these two investments.
The case for and against I Bonds
I Bonds are the simplest, no-hassle way to add inflation protection to your portfolio. The minimum purchase is $25, and the I Bond’s value will continue to climb tax deferred with inflation until maturity in 30 years – or until you sell the I Bond. There is no secondary market for I Bonds, so you simply hold them and sell them. The return you receive will closely match or exceed the Consumer Price Index.
An I Bond earns interest based on combining a fixed rate and an inflation rate.
The fixed rate will never change. So, if you bought an I Bond in 2014 with a fixed rate of 0.2%, it will continue to have a 0.2% fixed rate for the life of the bond. Purchases through October 31, 2021, will have a fixed rate of 0.0%. This fixed rate is the “real yield” – meaning after inflation – of an I Bond. The fixed rate will reset on November 1, and is highly likely to remain at 0.0%.
The inflation-adjusted rate changes each six months to reflect the running rate of inflation. That rate is currently set at 3.54% annualized. It will adjust again on November 1, 2021, for all I Bonds, no matter when they were purchased, and is likely to soar to 6.0% or higher, based on inflation from March to September 2021.
To get the I Bond’s actual rate of interest (the composite rate), the Treasury combines the fixed rate and the inflation rate. The combined rate will never be less than 0.0%, so I Bonds are protected against deflation. The current, inflation-adjusted value of an I Bond can never decrease, even in times of severe deflation.
The Treasury limits purchases of “electronic” I Bonds – purchased at TreasuryDirect – to $10,000 per person in each calendar year. You can also get up to up to $5,000 in paper I Bonds each year bought with your IRS tax refund. Although I Bonds seem mundane, a lot of very wealthy people fret over 0.1% changes in the fixed rate and scheme to get additional I Bonds through tax refunds or trust accounts. Why would they do that? Some reasons:
I Bonds allow an investor to push tax-deferred, inflation-protected money into the future, with zero risk. They can be used in combination with nominal Treasuries and bank CDs to preserve capital.
I Bonds allow you fantastic flexibility. You can redeem them after one year, costing you three months of interest. Or redeem them after five years and pay no penalty, or just hold them for 30 years and cash out.
I Bonds protect you against unexpected inflation. If inflation in the next 30 years suddenly soars to 7%, 10%, 15%, your principal will increase by that amount because of the inflation-adjusted interest rate.
I Bonds allow you to defer federal income taxes until you redeem them, so you pay zero in taxes until they are sold. This is a big advantage over TIPS, which carry current-year income taxes for both the coupon rate and the inflation adjustment to principal. (Both TIPS and I Bonds are free of state income taxes, an advantage over bank CDs.)
Interest on I Bonds is compounded semiannually and rolls into the I Bond’s balance, so you earn interest on your interest. With a TIPS, the coupon rate is paid out as current interest and doesn’t compound.
I Bonds are very simple to track as an investment. I use TreasuryDirect’s Savings Bond Calculator, which can be clunky but does work. See this. This is another huge advantage over TIPS held at Treasury Direct, which is a do-it-yourself proposition, even for downloading yearly tax forms. Want to track current value of your TIPS? Open up Excel and get to work. Treasury Direct is not going to tell you, in any easy-to-find way.
So, what are the negatives for I Bonds? 1) Today’s fixed rate of 0.0% means I Bonds can only match inflation, but not exceed it (except during deflationary periods), and 2) I Bonds cannot be purchased in a tax-deferred account or a Roth IRA. So, eventually, when sold, you will owe federal income taxes on the entire gain above the original purchase. This is a negative but can be offset by timing your I Bond sales to limit taxes.
The case for and against TIPS
Treasury Inflation-Protected Securities are a more complicated investment. The Treasury auctions TIPS – either new issues or reopenings – every month of the year. Investors can participate in these auctions by placing noncompetitive bids (the minimum is $100) at TreasuryDirect, again with zero fees or commissions. TIPS are auctioned with terms of 5, 10, and 30 years.
Immediately after the originating auction, the Treasury sets the coupon rate, which determines the interest paid twice yearly on the TIPS’ principal balance. But investors at the auction pay a price above or below par value, resulting in the TIPS’ real yield to maturity. The real yield is the amount the investor will earn above inflation (or sometimes below inflation) and is the most important factor in the auction. The principal balance of a TIPS rises (or falls) with monthly U.S. inflation continuously until maturity, and the resulting interest earned on the coupon rate also rises (or falls). At maturity, the investor gets back the original par value plus inflation.
For example, if a buyer was purchasing $1,000 in a 10-year TIPS auction and the real yield ended up being 1.1%, the coupon rate would be set at 1% and the buyer would get the TIPS at a discount, something like $990 for $1,000 in value. But in today’s market, real yields are deeply negative, so the real yield would be more like -1.0% and the coupon rate would be set at 0.125%, the lowest the Treasury will go for a TIPS. The price would be more like $112.50 for $100 of value, a steep premium because the real yield is so far below the coupon rate.
TIPS are considered “deflation protected” because an investor can’t receive less than the original par value at maturity, even in a time of severe deflation. But deflation can erode the inflation-adjusted principal balance of a TIPS. That can’t happen with an I Bond. And if you pay a premium price to purchase a TIPS, that premium over par is not guaranteed at maturity.
TIPS get complicated because once they are auctioned, they can be traded on a secondary market. The market value of a TIPS is constantly changing, and that means the real yield is also changing for new investors.
Investors can buy TIPS on the secondary market through brokerage firms, generally incurring a commission. Many brokerage firms also allow purchases at the Treasury auctions without commissions, which allows investors to put TIPS in tax-deferred accounts.
Phantom taxes are an issue with TIPS, because both the coupon rate (paid twice a year) and inflation adjustments to principal incur federal income taxes in the current year. But the investor receives only the coupon rate in the current year. The inflation adjustment isn’t paid until the TIPS is sold or matures. This is the reason many investment advisors recommend buying TIPS in tax-deferred accounts.
You can also purchase mutual funds that invest in TIPS, such as the TIP ETF (I prefer Schwab’s SCHP) or Vanguard’s short-term TIPS fund, VTIP. These funds are ideal for tax-deferred accounts, but investors need to know that the fund’s Net Asset Value will rise and fall with the value of the underlying TIPS.
My personal investing style is to buy TIPS at auction and then hold them to maturity, building out a ladder with TIPS maturing every year for 10+ years into the future. Ideally, this would be done in a tax-deferred account, making purchases through a brokerage. When a TIPS matures, I buy another one to fill a future ladder spot. I don’t follow the daily price fluctuations of the TIPS I own, because I have no intention of selling them before maturity.
In addition, I combine TIPS and I Bonds with other very safe nominal investments, such as bank CDs. In times of very low inflation or deflation, a bank CD may outperform an I Bond or TIPS.
I Bonds vs. TIPS: It’s not a contest
Historically, TIPS pay a yield premium over I Bonds, which makes sense because I Bonds have a more flexible maturity, better deflation protection, and tax-deferred interest. But that’s not the case right now. An I Bond held for 5 years would have a real yield of 0.0%, a massive 170-basis-point advantage over a 5-year TIPS with a real yield of -1.70%.
I Bonds are clearly the better investment, over a TIPS, through every maturity level. A 30-year TIPS currently has a real yield of -0.28%. Investors interested in inflation protection should buy I Bonds first, up to the $10,000 per person per year limit. Then consider an investment in TIPS.
The fact that I Bonds can’t be purchased in a tax-deferred account makes them unappealing for many retired investors. Why? Because they’d have to raise $10,000 in cash to purchase I Bonds each year. Raising cash incurs a tax liability. However, if an investor has cash sitting around earning 0.05%, I Bonds make a lot of sense. They can be redeemed after a year with the three-month interest rate penalty.
(I Bonds purchased before Oct. 31 are likely to earn an annual rate of 5% interest, before any penalty. But because the next variable rate to be set on November 1 is likely to exceed 6%, it would be smart for investors to wait at least 15 months before redeeming.)
Here’s a strategy many investors use: Buy I Bonds every year, up to the $10,000 per year limit, even if the fixed rate is 0.0%. The idea is to build a large cache of I Bonds to push inflation-protected money into the future. With TIPS, watch the auctions and buy when the yields look favorable, but commit to building a ladder stretching out 10 or more years, with TIPS maturing each year.
Investing in TIPS is a bit of a hassle, mainly because TreasuryDirect isn’t extremely user friendly. You have to download cryptic tax forms each year and fill out a 1099-OID tax form on the inflation adjustments. Tracking the current value of your TIPS requires downloading TIPS Inflation Index Ratios to determine the current inflation-adjusted balance. Good at Excel? It helps.
When you place an order for a TIPS at auction, you won’t know exactly what real yield you will get – that’s determined by the auction, which is also where the ‘big boys’ play – foreign central banks, hedge funds and insurance companies.
If all this seems intimidating, I suggest placing a couple of small orders to learn the routine. Remember, the minimum investment is $100 – take that, big boys!
Is inflation really a long-term problem?
And here is the key question: Is it worth devoting a portion of your asset allocation to inflation protection? I argue – strongly – that it is. Inflation over the last 10 years has averaged 1.9%, but current U.S. inflation is raging at an annual rate of 5.4%, and it appears this trend will continue through 2021, and possibly well into 2022.
With yields so low on safe investments like Treasuries and bank CDs, there is very little “cost” to buying inflation protection.
But I think that’s also what they told the people on board the Titanic. At some point, regardless of what the authorities are forecasting, investors need to grab for their life jackets or to head for the stairs anyway (and if I sound frustrated, it’s because we’re trying to hand people life preservers and they keep going back below decks). The worst thing that can happen if you’re wrong is that you’re feeling foolish, standing freezing on the deck of the ship and all really is well. The “Titanic Decision” matrix is below. I can tell you one thing: there is a single box there that I am pretty sure I want to avoid. What about you?
* * *
This article draws on information I first collected for a Seeking Alpha article in 2017.
David Enna is a financial journalist, not a financial adviser. He is not selling or profiting from any investment discussed. The investments he discusses can purchased through the Treasury or other providers without fees, commissions or carrying charges. Please do your own research before investing.
One thing for certain: Chicken livers are a bargain in 2021
By David Enna, Tipswatch.com
There’s a restaurant in my hometown – Charlotte, N.C. – that has been in business continuously at the same location on West Morehead Street since 1952. The restaurant business draws a notoriously fickle clientele, so that’s pretty remarkable.
The Open Kitchen was founded by Steve Kokenes, who was Greek, not Italian. His menu of pizza, lasagna, spaghetti and other “international” cuisine was a rarity for Charlotte in those days. The city didn’t get an “authentic” Italian restaurant – meaning, run by actual Italians – until the late 1980s. But that didn’t matter, the Open Kitchen specialized in simple, tasty comfort food and it prospered.
The restaurant expanded in the 1960s and 1970s. An interesting side note is that its location — once a dreary area of warehouses and factories — is now a booming area of modern apartments, art galleries, trendy breweries and “artisan” restaurants, very close to Bank of America Stadium. It’s now a very valuable piece of property, so I have to wonder if the owners will eventually sell the land.
The restaurant is still run by members of the Kokenes family, who wait tables and run the cash register. And they have a remarkable collection of Charlotte memorabilia displayed all over the walls. But what really caught my attention on a recent visit was a 1963 menu posted by the entrance to the dining room. It’s especially interesting since today’s menu contains many of the same items – with exactly the same names – 58 years later. Aha! This offers a unique look into inflation over the last 58 years, and … what could be in store for our future.
Where were you 58 years ago?
Back in 1963, $1 was worth … well, one dollar. And that is still true today. But adjusted for inflation (based on the Bureau of Labor Statistics’ Inflation Calculator) it takes $8.89 in today’s dollars to equal the buying power of $1 in July 1963. That is an increase of 789%, and it is my baseline for comparisons of price changes from 1963 to today.
Anyone who drove a car before the 1973 gas crisis fondly remembers gasoline at 25 cents a gallon. That’s what it was selling for back in 1963. Those were the days! But in reality, gas prices until recently were as cheap (relatively speaking) as they were in 1963. However, after a 41.8% increase in gas prices over the last 12 months, the cost of gasoline has now surged 1,172% since 1963, well over the rate of overall inflation
And look at the median U.S. home sales price – $329,522 in 2021 – up 1,731% since 1963, more than double the inflation rate. So even with the home price collapse in 2008, home prices have been running well above inflation. Same with the stock market, which has endured two major bear markets in the last two decades and yet is up 5,368% since 1963, nearly seven times inflation. Do these numbers bode well for the stock market and housing prices? Or are they an omen of rough times ahead?
At the same time, the U.S. minimum wage at $7.25 has lagged well behind inflation.
The Open Kitchen: Then, and now
The Open Kitchen menu items are pretty much in line – with some variations – with inflation over the last 58 years. Spaghetti with Meat Balls and Mushrooms (one of my favorite Open Kitchen offerings) costs $13.25 today versus $1.50 in 1963, a 783% increase and just slightly lower than inflation.
Want the more exotic Ravioli Parmigiana? That will cost you 980% more than it did in 1963, and probably destroy any hope you had of maintaining your diet. Want half spaghetti, half ravioli? (Good choice.) That will cost you $10.25 and I’d say that’s a bargain, but the price is 925% higher than the 1963 cost. So, dang, not a bargain.
The inflation-adjusted bargain on this menu is Spaghetti with Chicken Livers (now called Spaghetti ala Caruso), which at $13 is only 643% more expensive than in 1963, running well under overall U.S. inflation. (This dish is now relegated to very fine print at the bottom of the current menu. Understandable.)
The Open Kitchen also offers a new dish, “Chicken Livers Greque,” with this awesome description:
Plump, juicy chicken livers sauteed in butter, delicately seasoned with oregano and lemon. Served with garden salad and French fries. ($13.50)
I am imagining that The Open Kitchen doesn’t sell a lot of Chicken Livers Greque or ala Caruso, but it’s a testament to their sense of tradition that they keep these on the menu.
A real world example, in our lifetimes
If you were alive in 1963 — I was 10 years old then — you and I have seen U.S. inflation rise 789% in the last 58 years. Gasoline costs are up more than 1,000%. Same with the cost of a first-class postage stamp, and the typical American home.
Inflation is an unrelenting force. I look at today’s Open Kitchen prices and my reaction is “perfectly reasonable.” But imagine if you saw these prices in 1968. You’d have been stunned. Now, imagine the prices you could be seeing in 20, 30, 40 years.
Inflation exists. It’s a force that must be considered.
* * *
This article draws on information I first collected for a Seeking Alpha article in 2017.
David Enna is a financial journalist, not a financial adviser. He is not selling or profiting from any investment discussed. The investments he discusses can purchased through the Treasury or other providers without fees, commissions or carrying charges. Please do your own research before investing.
The U.S. Treasury’s $8 billion reopening auction today of CUSIP 912810SV1 generated a real yield to maturity of -0.292%, the lowest ever for any TIPS auction of this term.
The auction created a 29-year, 6-month Treasury Inflation-Protected Security, carrying a coupon rate of 0.125%, the lowest the Treasury will go for any TIPS. .
A TIPS is an investment that pays a coupon rate well below that of other Treasury investments of the same term. But with a TIPS, the principal balance adjusts each month (usually up, but sometimes down) to match the current U.S. inflation rate. So, the “real yield to maturity” of a TIPS indicates how much an investor will earn above (or below) inflation.
Because the auction’s real yield to maturity was so far below the coupon rate of 0.125%, investors at Thursday’s auction had to pay a lofty premium over par for this TIPS. The adjusted price was about $117.72 for about $104.33 of value, after accrued inflation is added in.
This TIPS will carry an inflation index of 1.04326 on the settlement date of Aug. 31. That means investors paid an extra 4.3% above par, but will receive a matching amount of inflation adjustment. The unadjusted price — reflecting just the real yield versus coupon rate — was about $112.84 for $100 of par value.
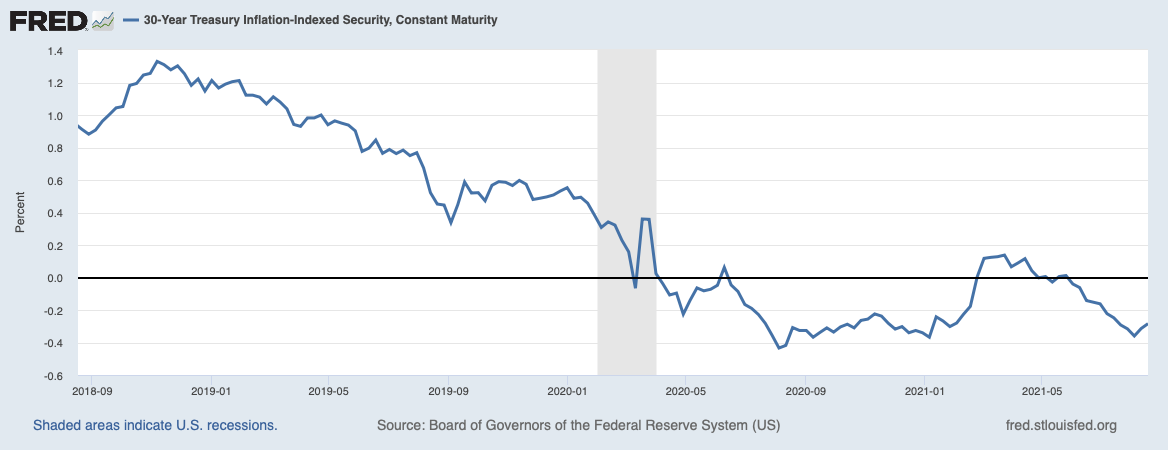
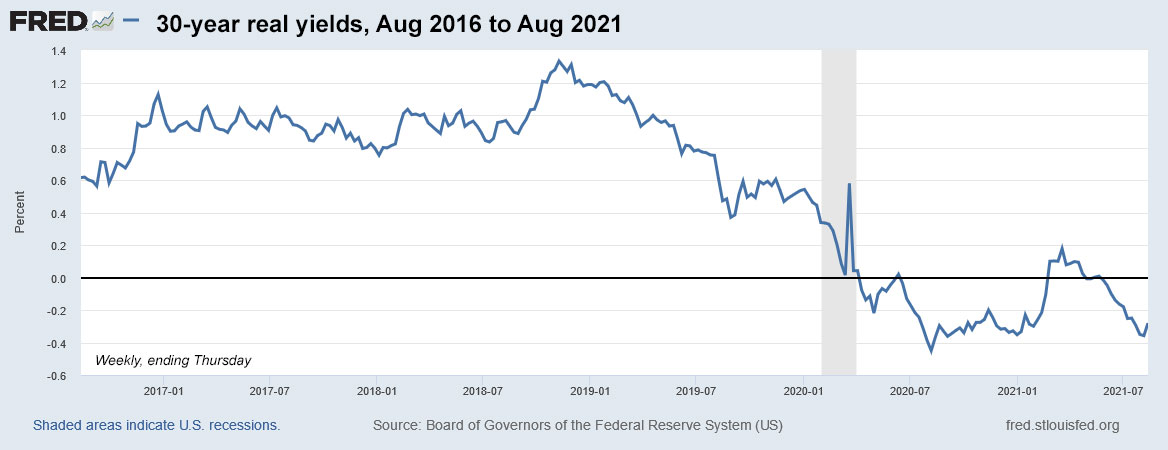
Here is the trend in 30-year real yields over the last two years, showing the dramatic move lower in the wake of the Federal Reserve intervention beginning after the COVID-19 surge in March 2020 and continuing today:
Inflation breakeven rate
With a 30-year nominal Treasury yielding 1.88% this afternoon, this TIPS gets an inflation breakeven rate of 2.17%, which looks entirely reasonable. U.S. inflation over the last 30 years has averaged 2.3%, the lowest for any 30-year period beginning with 1971. So today’s breakeven number looks pretty attractive by historical standards.
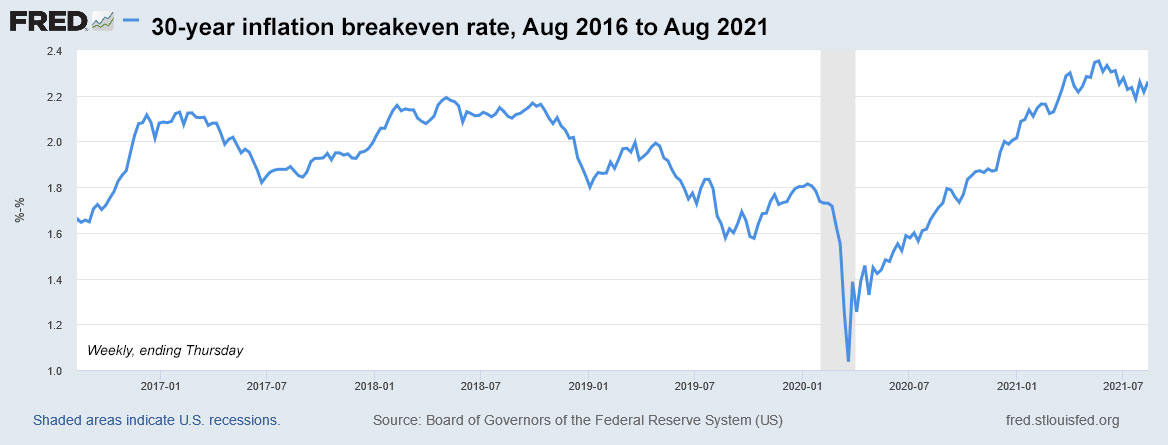
Here is the trend over the last two years in the 30-year inflation breakeven rate, showing that inflation expectations have been leveling off after a surge higher through most of 2020 and into the spring of 2021:
Reaction to the auction
CUSIP 912810SV1 trades on the secondary market, and had been trading with a real yield to maturity of 0.30% through the morning. So the auction result looks just about right. Close enough, anyway. The TIP ETF — which holds the full range of maturities — took a bounce higher after the auction close, which indicates a positive reaction to the auction.
A 30-year TIPS is a unique investment with little appeal to small-scale investors. The Treasury reported that only $2.9 million — that’s million — of the $8 billion offering was sold through TreasuryDirect. In all, only $5.6 million was purchased through non-competitive bids, the only option open to small-scale investors.
The auction’s bid to cover ratio was 2.34, not stellar but acceptable.
For big-scale investors — like foreign central banks, hedge funds and pension funds — the relatively low inflation breakeven rate was enough to make this TIPS appealing, at least versus a 30-year nominal Treasury yielding 1.88%.
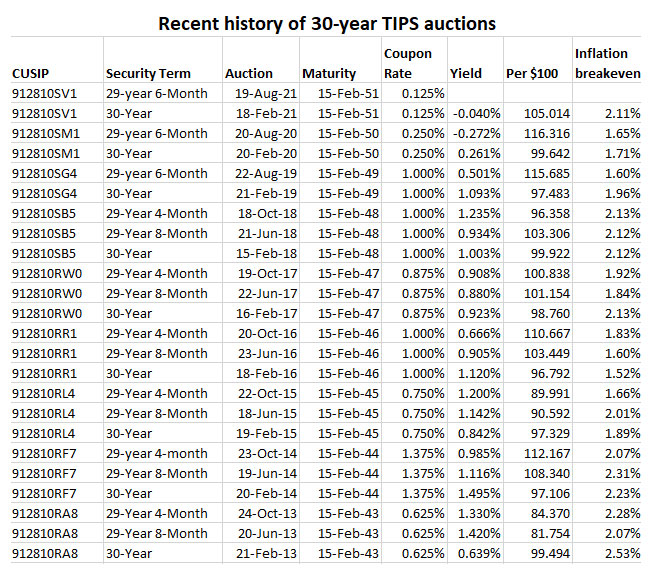
This auction closes the books on CUSIP 912810SV1, the only 30-year TIPS in history to get a coupon rate of 0.125%. Here the history of 29- to 30-year TIPS auctions from 2018 to 2021:
* * *
David Enna is a financial journalist, not a financial adviser. He is not selling or profiting from any investment discussed. The investments he discusses can purchased through the Treasury or other providers without fees, commissions or carrying charges. Please do your own research before investing.
Not much to like here. But will big-money investors jump aboard?
By David Enna, Tipswatch.com
First, let me get this off my chest: I’m not a fan of 30-year Treasury Inflation-Protected Securities. The long term is beyond my likely lifespan, and my investment style is to buy and hold TIPS to maturity.
A 30-year TIPS is a very volatile investment, and that can make it appealing to a gutsy bond trader. But even then, I think you’d need nerves of steel to jump aboard the Treasury’s reopening auction Thursday of a 30-year TIPS, CUSIP 912810SV1, even as we seem to be nearing an end to the Federal Reserve’s aggressive bond-buying stimulus.
Then again, with 30-year real yields at a record low, every single 30-year TIPS ever auctioned is now worth more than the original auction price. Traders, rejoice. Then … sell?
(I do hold two previous 30-year TIPS from long-ago auctions. CUSIP 912810FH6 with a coupon rate of 3.875%, maturing in April 2029, and CUSIP 912810QP6 with a coupon rate of 2.125%, maturing in February 2041. Those are my treasured little babies, and I’m not selling.)
What to expect
The Treasury is offering $8 billion of this 29-year, 6-months TIPS. It originated in an auction Feb. 18, 2021, with a real yield to maturity of -0.04%, just barely negative to future inflation. Its coupon rate was set at 0.125% and investors paid an adjusted price of about $105.01 for about $100.08 of value, after accrued interest and inflation were added in. That result ended up looking good for investors because the real yield came in at least 10 basis points higher than expected.
Now, six months later, you can track this TIPS on Bloomberg’s Current Yields page. It closed Friday with a real yield of -0.32% and a price of about $113.69. If that yield holds through Thursday’s auction, it would be the lowest ever for a TIPS auction of this term. The previous low of -0.272% was set a year ago, Aug. 20, 2020. Only two 29- to 30-year TIPS auctions have ever resulted in a negative real yield. Thursday’s auction will be the third.
The premium price is so high because of the spread between the coupon rate of 0.125% and the real yield of -0.32%. And it shows how the ultra-long maturity magnifies the risk (and possible gain) of a 30-year TIPS.
CUSIP 912810SV1 will carry an index ratio of 1.04326 on the settlement date of Aug. 31, meaning that investors will pay an adjusted price about 4.3% more than the purchase price, but receive a matching amount of additional principal. As a rough estimate, an investor seeking $10,000 of this TIPS could end up paying $11,700 for about $10,432 of value. Ouch.
Here is the trend in 30-year real yields over the last five years, showing the quick decline below zero as the Federal Reserve began aggressive bond-buying in March 2020. Although the real yield popped above zero from February to March 2021, it has again settled into a deeply negative range:
Inflation breakeven rate
With a 30-year nominal Treasury bond yielding 1.93%, this TIPS currently has an inflation breakeven rate of 2.25%, a bit high by historic trends but a reasonable number. Here is the trend in the 30-year inflation breakeven rate over the last five years:
The one remarkable thing about this chart is the massive surge higher after both Congress and the Federal Reserve launched aggressive economic stimulus programs in March 2020. Those measures have ignited inflation, as reflected by the current annual rate of 5.4%. The breakeven rate of 2.25% isn’t wildly out of normal. U.S. inflation over the last 30 years has averaged 2.3%, the lowest for any 30-year period beginning with 1971. So a breakeven rate of 2.25% looks entirely reasonable.
Final thoughts
I’m not going to be an investor in this TIPS. No secret there. Will big-money investors — the usual market for a 30-year TIPS — be enthusiastic buyers? I’m doubting that. A record-low real yield on a volatile long-term investment isn’t very appealing, especially as the Federal Reserve appears just months away from slowing down its bond buying. On the other hand, the inflation breakeven rate of 2.25% makes this TIPS a bit more appealing than a nominal 30-year Treasury.
I think we could see some surprises at this week’s auction. Could the real yield jump a bit higher, as it did in January’s weak auction? We’ll see. I’ll be on the road this week but will try to post the auction results as soon as possible after the 1 p.m. EDT close.
Meanwhile, here’s a history of recent 29- to 30-year TIPS auctions, showing how rare it is to have a 30-year TIPS with a negative real yield and a coupon rate of 0.125%:
* * *
David Enna is a financial journalist, not a financial adviser. He is not selling or profiting from any investment discussed. The investments he discusses can purchased through the Treasury or other providers without fees, commissions or carrying charges. Please do your own research before investing.


I'm already familiar with the product and was curious if Tipswatch had ever done any rate predictions for it, like…