
By David Enna, Tipswatch.com
I’ve just returned to Quito, Ecuador’s capital city, after spending five days in the Amazon jungle at a surprisingly pleasant eco lodge on a tributary of the Napo River.

The good news: We saw four different types of monkeys, 40+ species of colorful birds, gorgeous wild plants, a bunch of giant rodents and two tarantulas. The bad news: My internet access was extremely limited and even now is quite slow. Next week will probably get much worse, so I thought I’d better take the time now to catch up on financial events of the last week.
The Fed
I haven’t been able to closely follow the Fed’s actions or listen to Powell’s press conference. But from what I can gather, the Fed decided to raise its federal funds rate 25 basis points, to a range of 5.00% – 5.25% and then call a halt, at least temporarily.
I like this move and it is what I expected as the United States continues slogging through a slow-motion banking crisis. It does mean that short-term interest rates will be slightly higher than current U.S. inflation (now at 5.0% annually). Of course, this week’s April inflation report could change that equation. I think the Fed knows troubled times are coming, because of …
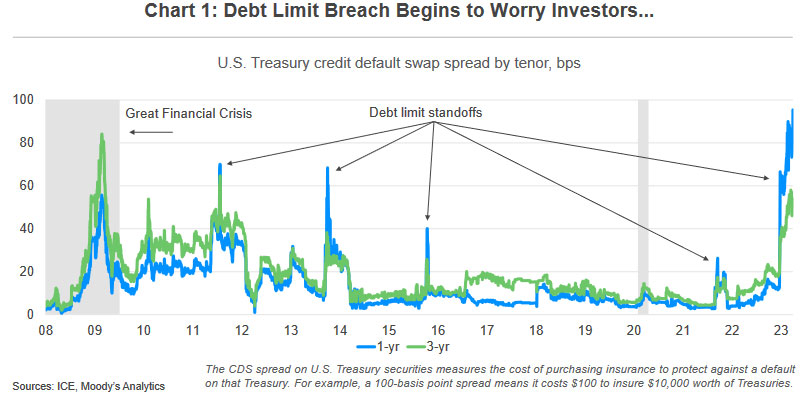
The debt-limit crisis
I saw that the Treasury Secretary Janet Yellen theorized that the x-date for hitting a hard debt limit could come as soon as June 1, or possibly early July. That was earlier than expected and not good news. Congress remains deadlocked and no compromise looks possible. A more likely result will be a temporary extension of the debt limit, possibly through September, to allow more time for serious talks.
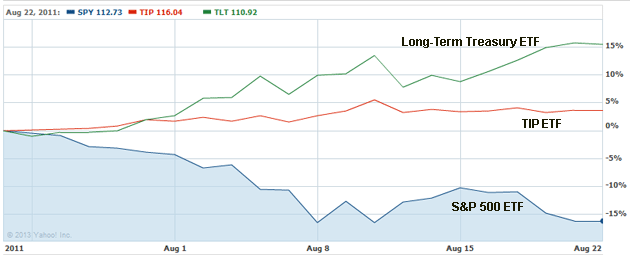
This debt limit fiasco seems to have had little effect — so far — on the U.S. stock market, which finished last week down about 0.8%. Not bad. Of course, the Fed decision to halt interest rate increases was a counter-balancing positive for the market.
T-bill yields
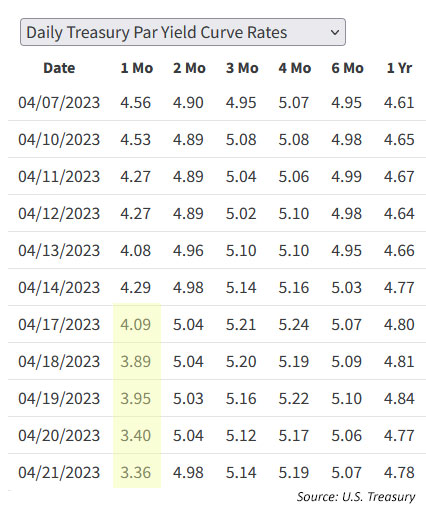
I have written about how similar debt-ceiling events in 2011 and 2013 caused brief disruptions in short-term Treasury yields, with investors demanding higher yields because of the potential turmoil. In recent weeks, we saw this brewing right before our eyes with investors pouring into 4-week T-bills (in theory maturing before the crisis) and demanding higher yields on 8-, 13- and 26-week T-bills, which looked likely to get caught in the political mess.
Now, with Yellen announcing a potential x-date of June 1, that situation has reversed, and the 4-week T-bill is now most at risk. The result: Last week’s 4-week Treasury auction got an investment rate of 5.964%, up an incredible 206 basis points from 3.905% the week before.

This trend is likely to continue — and worsen — as a true hard debt limit looms over the market in coming weeks.
Real yields
I’m pleased to see that nothing “major” has been happening with real yields of Treasury Inflation-Protected Securities as we approach the next TIPS auction, the May 18 reopening auction of CUSIP 91282CGK1, a 10-year TIPS.
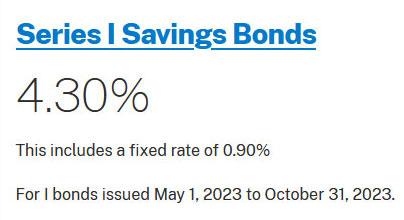
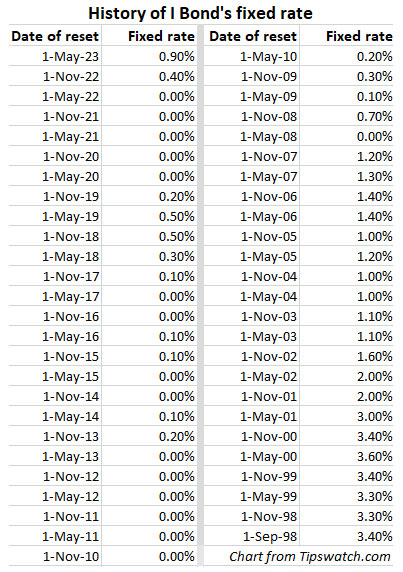
The 10-year real yield is holding at 1.23%, down about 13 basis points since the beginning of May. At this point, that auction still looks attractive, but it also makes the current I Bond with a fixed rate of 0.9% look very competitive.

The most interesting trend from February to May 2023 has been the widening of the long end of the TIPS yield curve. I have been expecting that to happen as the Fed begins winding down this tightening cycle. But I am not expecting yields to decline much on the short end. We’ll see.
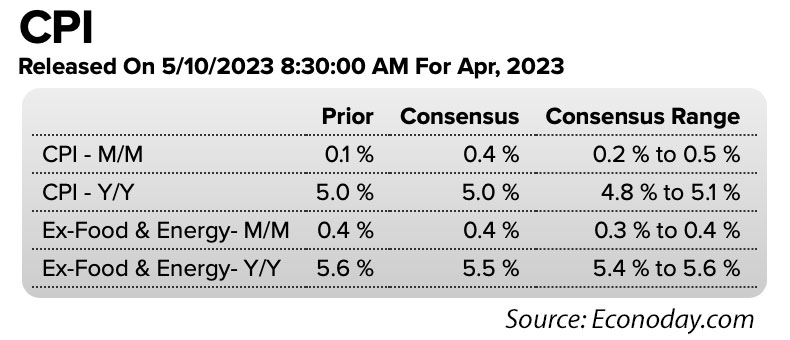
Wednesday’s inflation report
Consensus estimates are pointing toward April inflation coming in at 0.4% for the month and 5.0% for the year, which would hold steady with the March number. Core inflation is expected come in at 0.4% for the month and 5.5% year-over-year. None of this can be viewed as “good news,” and if inflation comes in higher than expected, it could rile financial markets.
The U.S. dollar
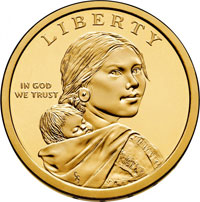
In Ecuador, the official currency is the U.S. dollar for all transactions. This country widely uses the U.S. $1 coin, which you rarely see in the United States. The U.S. dollar gives this nation a stable economic base for foreign investment, as long as exports are strong. Oil is the largest export at 32% of all exports, and yes, drilling is expanding in the Amazon region.
One predictable side effect of the combination of the Fed rate-hike halt and looming debt crisis is a decline in the value of the U.S. dollar, which has lost 2.3% of its value year to date. A weaker dollar creates an inflationary trend, which could counteract some of the Fed’s attempts to slow inflation. This is a trend to watch.

My schedule
By Wednesday morning I will be in the Galapagos Islands and facing highly uncertain internet connections and shifting schedules for activities. I am not sure when I will be able to post an analysis on the CPI report or preview article on the May 18 TIPS auction. In addition, I may have trouble approving and responding to your comments. Be patient!
* * *
Feel free to post comments or questions below. If it is your first-ever comment, it will have to wait for moderation. After that, your comments will automatically appear.Please stay on topic and avoid political tirades.
David Enna is a financial journalist, not a financial adviser. He is not selling or profiting from any investment discussed. I Bonds and TIPS are not “get rich” investments; they are best used for capital preservation and inflation protection. They can be purchased through the Treasury or other providers without fees, commissions or carrying charges. Please do your own research before investing.


I suppose someone can wait 3 more years to buy TIPs, but I plan to just keep on buying TIP…