Short-term Treasurys: Is it time to go out a little longer?

Yields could continue to rise, but it may be time to think longer term.

By David Enna, Tipswatch.com

In the last week, I got calls from CNBC and Bloomberg reporters asking to talk about the rise in demand for short-term Treasurys, triggered by the recent surge in yield on a 26-week T-bill to 5+%.

Why is that a big deal? Well, take a look at this amazing chart:

Click on image for larger version

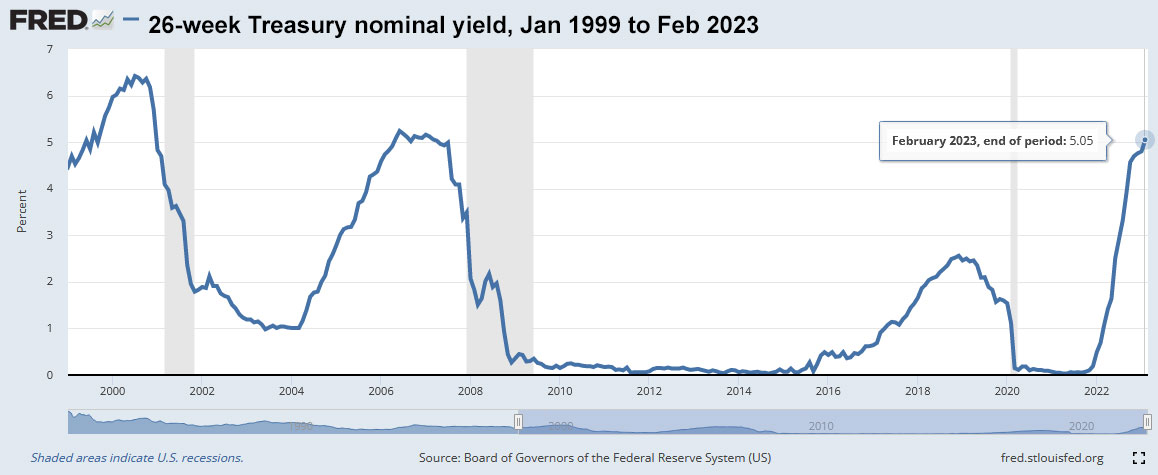
Last week, the 26-week Treasury bill crossed the 5% barrier for the first time since July 2007 — nearly 16 years ago. And for much of those 16 years, nominal yields on this ultra-safe investment were hugging very close to zero. Getting a no-risk, short-term return of 5% on your money is highly appealing, even if U.S. inflation continues to run at an annual rate of 6.4%.

Last July, I wrote an article detailing a strategy for staggering purchases of 13-week and 26-week Treasury bills, spacing out purchases and then rolling them over to capture rising interest rates, while also preserving easy access to your money. At the time, the 13-week was yielding 1.73%; today it is at 4.68%. The 26-week was yielding 2.62%; today it is 5.05%.

That strategy worked very well: It got money working immediately while also capturing future increases in interest rates. But at some point, possibly in the next six months, the Federal Reserve is going to call a halt to rate increases and move into “hold” mode. The rollover strategy would still work, but there will be no short-term rate increases to capture.

What’s the next move?

As interest rates near a peak — and I don’t claim to know when that will be — wouldn’t it be smart to begin allocating some funds to longer terms of U.S. Treasurys? Eventually, maybe sometime in 2024, short-term rates will begin moving lower (I think). At that point,the rollover strategy won’t be attractive.

Just look at the 26-week yield chart again. Notice how each time the yield peaks it begins a rather quick move downward? And notice how the past peaks have been followed rather quickly by a recession? Is that where we are heading?

Also, consider that if you buy a 26-week Treasury this week (the next auction is Monday), it is going to mature in August, possibly right at the peak of the U.S. debt crisis. Will that really matter? Probably not, but things could get a little crazy between now and then. And could that craziness make the Fed more cautious?

Longer-duration Treasurys will generally do well in a recession because interest rates are likely to fall, resulting in a higher value for your investment. Nothing is certain, of course, but the market seems to be shifting its focus toward medium-term Treasurys.

Here are January vs. February auction results for Treasury issues of various terms:

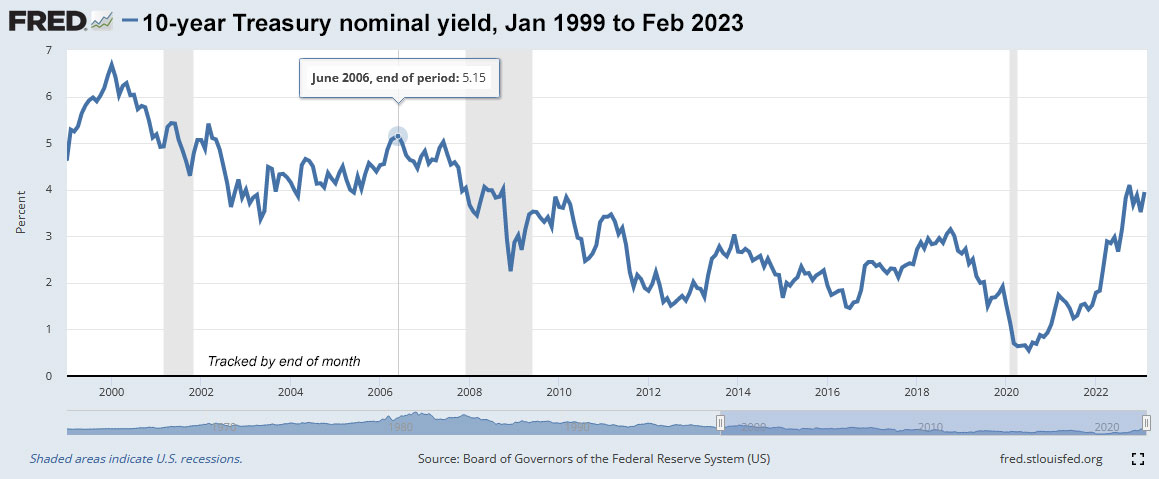
The chart shows that the 26-week T-bill is now the “sweet spot” investment, with the highest nominal yield across the entire maturity spectrum. But … notice how yields have been rising faster for the longer-term Treasurys, with the yield on a 5-year Treasury note rising 58 basis points in a month, versus 24 basis points for the 26-week. The 10-year Treasury note is now trading around 3.95%.

These longer-term yields may continue to rise, but they are starting to get attractive, matching the highs of October 2022 and closing in on the highs of June 2006. Here are long-term views for the 2-, 5- and 10-year Treasury notes:

Click on an image for a larger version.

What’s the strategy?

My idea is to add some medium- or even longer-term nominal Treasurys if I can find attractive rates, as a hedge against future recession and eventual declines in interest rates.

Keep in mind that 4-week to 26-week Treasury bills will remain the ideal investment for your short-term cash needs. Another sensible option for cash is a top-of-class money market fund, such as Vanguard’s Treasury Money Market Fund (VUSXX), with a 7-day SEC yield of 4.55%.

Are bank CDs an option? Sure. Online banks often offer promotional rates to lure your investment. You can probably find a 6-month CD paying 4.75% or a one-year at 5%. Those rates are competitive. Also, you can find 5-year CDs paying around 4.65%, also competitive. But do you really want to open another new account at an unknown bank? Plus, interest from these accounts face state income taxes, while Treasurys are free of state taxation.

So this week I decided to hunt through the secondary Treasury market to see if I could find a 5-year Treasury yielding close to 5%, or a 10-year at 4%. (I’d prefer to see the 10-year at 5%, but I decided to be realistic.) My plan was to nibble into these nominal investments as a backstop to my ladder of TIPS investments.

As of Friday afternoon, my search failed but the market is getting close, at least for the 10-year:

Market conditions right now remind me a lot of late September and October 2022, when nominal and real yields were peaking. At that time, I bought a 5-year Treasury note at auction with a yield of 4.22%, very close to today’s market. But by early November, yields began falling in reaction to a series of weak inflation reports.

I doubt that yields will plummet in the near term, and the Federal Reserve seems strongly committed to raising short-term interest rates another 50 to 75 basis points before summer. So let’s be realistic, I’ll admit I have no strategy. I just want to hedge my inflation bets with some reasonable nominal yields.

After hunting around Friday, I ended up making a “nibble” investment in CUSIP 91282CAE1, which matures Aug. 15, 2030. It has a coupon rate of 0.625%. The price was 78.453, resulting in a yield to maturity of 3.99%. This is how it would work if I had invested $10,000:

  • Cost of investment: $7,845.30
  • Future interest: about $471
  • Paid at maturity: $10,000
  • Total return about $10,471.

Not spectacular, I admit. I think we may see better opportunities in coming weeks.

Conclusion. As the Federal Reserve nears the end of its rate-hiking cycle, it could be wise to look at stretching out the term of your Treasury investments, at least a bit. If recession strikes, interest rates are likely to fall, boosting the value of a nominal Treasury.

However, “this time could be different,” especially if inflation continues at high levels. Then the Federal Reserve would have to continue pushing rates higher. Nothing is certain.

* * *

Feel free to post comments or questions below. If it is your first-ever comment, it will have to wait for moderation. After that, your comments will automatically appear.Please stay on topic and avoid political tirades.

David Enna is a financial journalist, not a financial adviser. He is not selling or profiting from any investment discussed. I Bonds and TIPS are not “get rich” investments; they are best used for capital preservation and inflation protection. They can be purchased through the Treasury or other providers without fees, commissions or carrying charges. Please do your own research before investing.

Posted in Investing in TIPS | 78 Comments

I Bonds: Here’s a simple way to track current value

TreasuryDirect’s information often confuses investors. There is another way.

By David Enna, Tipswatch.com

Almost every week, I get questions about the way TreasuryDirect shows the current value of I Bonds purchased within the last five years. Here are recent examples:

“I-Bond was purchased last April. So far … the actual annual earning rate is not 7.12% as we saw last April but low. Is it because the current holding has not included the last 3 month interest? Can you explain it? Thank you.”

… “I invested $10,000 on 6/13/22 and I only gained $156 in value on 11/1/22. That seems low given that the interest rate was 9.62%. Help!”

The usual advice. You can check the total value of your Series I Savings Bonds after logging into TreasuryDirect’s account pages and then clicking through to the totals for the individual bonds. Or you can use the Treasury’s Savings Bond Calculator, which TreasuryDirect claims is only for paper I Bonds (maximum amount of $5,000 each) and isn’t accurate for electronic I Bonds. But it is accurate for electronic bonds, you just have to double the $5,000 amounts for purchases of $10,000 in that form.

I wrote a step-by-step guide to using the Savings Bond Calculator back in June 2018, and I think the basics remain just about the same. One of the advantages of using the calculator is that it creates a browser-based file you store on your computer. It can be updated without actually logging in to TreasuryDirect, and then saved again.

Confusion arises when investors check account balances at TreasuryDirect — or use the Savings Bond Calculator — because they will not see the last three months of interest for I Bonds that have not been held five years. I’ve written about this several times, including this August 2022 article: “Don’t go ballistic over the way TreasuryDirect reports I Bond interest.”

But there is actually a very easy way to track the current value of your I Bonds, including those three months of interest that TreasuryDirect hides for recent purchases.

Eyebonds.info: A valuable resource

If you want to track the current value of your I Bond investment, Eyebonds.info is an excellent and reliable site. It’s a creation of Bob Hinkley, a retired corporate financial analyst and computer programmer (and famed Boglehead contributor). It’s very simple to use:

  1. Go to the homepage.
  2. Click on I Bonds.
  3. Find the month you purchased the I Bond in the table and click on it.
  4. Click on the investment amount listed below that matches your original investment.

The page that then displays the earned-interest history of your I Bond, all the way to the end of the your current composite rate (the end month depends on the month you purchased the I Bond). The numbers presented do not subtract the last three months of interest, so remember if you redeem early, you will lose those three months of interest.

Now, let’s run through some examples. In these examples, I am presenting results for a $10,000 investment in April of various years. The top section of each chart shows the Savings Bond Calculator’s presentation (doubled to match the $10,000 investment). The bottom section of each example comes from Eyebonds.info.

Click on the image for a larger version.

Example 1 is for a $10,000 I Bond purchased in April 2022. TreasuryDirect shows a value of $10,436, but that does not include the last three months of interest. The Eyebonds.info presentation shows a current value (as of Feb. 1, 2023) of $10,684 and continues with interest calculations through October 1. Note that the Eyebonds.info information for Nov. 1, 2022, matches TreasuryDirect’s calcuation, because it does not include interest for November, December and January.

Also, note that I Bonds earn interest for the previous month on the first day of each month. Don’t get confused by that. You don’t earn interest until the month is completed.

Click on the image for a larger version.

Example 2 is for a $10,000 I Bond purchased in April 2021. TreasuryDirect shows a value of $10,712, minus the three months interest. Eyebonds.info shows a current value of $10,968, which includes the last three months of interest through the end of January.

Click on the image for a larger version.

Example 3 is for a $10,000 I Bond purchased in April 2020. TreasuryDirect shows a value of $10,936, which excludes the last three months of interest. Eyebonds.info shows a Feb. 1 value of $11,200, which includes those three months of interest.

Click on the image for a larger version.

Example 4 is for an I Bond issued in April 2017, which has now passed the five-year holding period and is no longer subject to the three-month interest penalty. TreasuryDirect shows a February 2023 value of $11,892, exactly matching the information on Eyebonds.info because the interest penalty is no longer in effect.

TreasuryDirect’s reasoning

By eliminating (hiding, actually) the last three months of interest for I Bonds held less than 5 years, TreasuryDirect is attempting to cause less confusion, not more confusion. If it showed the full total, and investors redeemed early, they would swamp TreasuryDirect with complaints they were cheated. So TreasuryDirect focuses on presenting an accurate current redemption value, not current total value.

I’ve suggested that TreasuryDirect simply create two columns, one for redemption value and one for current value. That would really lessen investor confusion. But … that’s not happening.

Anyway, Eyebonds.info is a tremendous resource for tracking and understanding the current and near-future value of your I Bonds. It also has historical information on TIPS, and a treasure-chest of information on U.S. inflation dating back to 1971.

The site also has an Excel-based I Bond Calculator you can download. I haven’t used it, but a lot of my readers seem passionate enough (and nerdy enough?) to give it a try. Let me know how it works. For me, the Savings Bond Calculator and Eyebonds.info are all I really need.

I Bonds: A not-so-simple buying guide for 2023

Confused by I Bonds? Read my Q&A on I Bonds

Let’s ‘try’ to clarify how an I Bond’s interest is calculated

Inflation and I Bonds: Track the variable rate changes

I Bond Manifesto: How this investment can work as an emergency fund

* * *

Feel free to post comments or questions below. If it is your first-ever comment, it will have to wait for moderation. After that, your comments will automatically appear.Please stay on topic and avoid political tirades.

David Enna is a financial journalist, not a financial adviser. He is not selling or profiting from any investment discussed. I Bonds and TIPS are not “get rich” investments; they are best used for capital preservation and inflation protection. They can be purchased through the Treasury or other providers without fees, commissions or carrying charges. Please do your own research before investing.

Posted in Investing in TIPS, TreasuryDirect | 29 Comments

30-year TIPS auction gets a real yield of 1.55%, highest in nearly 12 years

By David Enna, Tipswatch.com

A new 30-year Treasury Inflation-Protected Security — CUSIP 912810TP3 — auctioned today with a real yield to maturity of 1.550%, the highest auctioned yield for this term since June 2011.

The auction seems to have attracted lukewarm demand. A 29-year TIPS was trading on the secondary market all morning with a real yield of 1.53% and the “when issued” yield prediction for this TIPS was also 1.53%. The bid to cover ratio was a middling 2.38.

So investors were able to nab a slightly higher real yield, and that’s a good result. The real yield to maturity of 1.55% was the highest for any 29- to 30- year TIPS at auction since June 2011, when a 29-year, 8-month TIPS got a real yield of 1.744%. The Treasury set the coupon rate at 1.50%, the highest for any TIPS since a February 2011 new-issue auction at 2.125%.

Definition: The “real yield” of a TIPS is its yield above official future U.S. inflation, over the term of the TIPS. So a real yield of 1.55% means an investment in this TIPS will exceed U.S. inflation by 1.55% for 30 years. If inflation averages 2.3%, you’d get a nominal return of 3.85%, on par with a nominal 30-year U.S. Treasury. But if inflation averages 4.5%, you’d get a nominal return of 6.05%.

Here is the trend in the 30-year real yield since January 2021, more than a year before the Federal Reserve began aggressive moves to increase interest rates and fight inflation:

Pricing for this TIPS

The unadjusted price was $98.804809 for $100 of value, meaning that investors actually paid less than par value for this TIPS.

The key factors here are that the unadjusted price was about $98.80 for $100 of value and the inflation index on the settlement date of Feb. 28 will be 0.99857. Accrued interest will be about 53.8 cents per $1,000 investment. Here is how the pricing works out:

One note: Anyone who purchased $10,000 in this TIPS got $10,000 in par value, but the actual principal total on the settlement date of Feb. 28 will be $9,985.70, because the inflation index was less than 1.0. This reflects deflation of 0.31% recorded in December 2022. But in March, this TIPS will get an inflation accrual of 0.8%, based on non-seasonally adjusted inflation recorded in January 2023.

Inflation breakeven rate

With a 30-year nominal Treasury trading with a yield of 3.90% at the auction’s close, this TIPS gets an inflation breakeven rate of 2.35%, a bit higher than recent results for this term. In the February 2022 auction for this term, the breakeven rate was 2.11%. Here is the trend in the 30-year inflation breakeven rate since January 2021, showing the fairly strong variations caused by the financial market’s hot and cold opinions of U.S. inflation:

Reaction to the auction

Source: Yahoo Finance

It was a good result for investors, with both the real yield and coupon rate topping 1.5%, the highest in nearly 12 years. The TIPS market seems to be reacting with a yawn, with the TIP ETF barely nudging higher after the auction’s close. The 30-year maturity isn’t highly traded and makes up only a small portion of the TIP ETF’s holdings. No big deal, it appears.

For people with the fortitude to buy a highly volatile 30-year Treasury, this is an attractive purchase, locking in a yield 1.55% higher than official U.S. inflation over 30 years.

Here is a recent history of auctions of this term:

Confused by TIPS? Read my Q&A on TIPS

TIPS in depth: Understand the language

TIPS on the secondary market: Things to consider

Upcoming schedule of TIPS auctions

* * *

Feel free to post comments or questions below. If it is your first-ever comment, it will have to wait for moderation. After that, your comments will automatically appear.Please stay on topic and avoid political tirades.

David Enna is a financial journalist, not a financial adviser. He is not selling or profiting from any investment discussed. I Bonds and TIPS are not “get rich” investments; they are best used for capital preservation and inflation protection. They can be purchased through the Treasury or other providers without fees, commissions or carrying charges. Please do your own research before investing.

Posted in Investing in TIPS | 15 Comments

January inflation came in higher than expected, rising 0.5% to an annual rate of 6.4%

Non-seasonally adjusted inflation rose 0.8%, giving a boost to investors in TIPS and I Bonds.

By David Enna, Tipswatch.com

The January inflation report, just released by the Bureau of Labor Statistics, showed a return to higher-than-expected U.S. price increases, after several months of mild inflation.

The Consumer Price Index for All Urban Consumers rose 0.5% in January on a seasonally adjusted basis, the BLS said. Over the last 12 months, the all-items index increased 6.4%. January’s monthly number equaled economist expectations, but the year-over-year rate was above expectations of 6.2%. Core inflation, which removes food and energy, increased 0.4% for the month and 5.6% for the year. Both of those numbers were higher than expectations.

Looking for a positive spin? The all-items annual increase of 6.4% was the smallest 12-month increase since the period ending October 2021, the BLS said.

Both all-items and core inflation were heavily influenced by the cost of shelter, which accounted for nearly half of the all-items increase in January. Shelter costs were up 0.7% for the month and 7.9% year-over-year. Shelter costs tend to be controversial, at least to CNBC talking heads, because they are considered a lagging indicator. More from the report:

  • Costs for food at home increased 0.4% in January and were up 11.3% year over year. The index for eggs rose 8.5% for the month. In contrast, the fruits and vegetables index fell 0.5%.
  • Gasoline prices increased 2.4% for the month after falling 9.3% over the previous two months. Gas prices are now up just 1.5% year-over-year.
  • Costs for utility gas service increased 6.7% for the month and are up 26.7% for the year.
  • The medical care services index fell 0.7% in January, to an annual rate of 3.0%.
  • Costs for used cars and trucks fell 1.9% for the month, the 7th straight month of decreases. These costs are now down 11.6% from the elevated level of 2022.
  • Costs for new vehicles rose 0.2% for the month and are up 5.8% for the year.

The January report incorporates reweightings of the sector indexes to reflect consumer survey information from 2021. For more on this, see the BLS fact sheets. Based on BLS estimates, this reweighting could have slightly increased the all-items number versus the old weightings, since costs of shelter got a higher weighting and used vehicles got a lower weighting.

Here is the one-year trend for annual all-items and core inflation, showing how the two rates are aligning as shelter prices rise and gasoline prices moderate. Both all-items and core inflation, while remaining high, have been trending lower since September:

What this means for TIPS and I Bonds

Investors in Treasury Inflation-Protected Securities and U.S. Series I Savings Bonds are also interested in non-seasonally adjusted inflation, which is used to adjust principal balances on TIPS and set future interest rates for I Bonds. For January, the BLS set the CPI index at 299.170, an increase of 0.80% over the December number.

For TIPS. The January inflation report means that principal balances for all TIPS will increase 0.8% in March, after falling 0.1% in January and 0.31% in February. As I noted in a recent article, non-seasonal inflation tends to track lower in the last six months of the year and higher in the first six months. Here are the new March Inflation Indexes for all TIPS.

For I Bonds. January’s inflation report is the fourth in a six-month string that will determine the I Bond’s new variable rate, which will be reset on May 1 based on inflation from October 2022 to March 2023. For the first three months of that period, inflation ran at 0.0%, but January’s number boosts the total to 0.8%. That would translate to a variable rate of 1.6%, down from the current 6.48%. But two months remain, and those months are likely to record positive inflation.

I had been saying I thought the May variable rate reset would be at least 2%,but now it looks like it could be a bit higher, possibly above 3%. Of course, with inflation, nothing is certain.

Here are the data I am tracking, so far:

View historical data on my Inflation and I Bonds page.

What this means for future interest rates

Because January inflation came in higher than already-elevated expectations, I’d say there is nothing here that would change the Federal Reserve’s stated course toward at least one more (and probably two) 25-basis-point increases in its federal funds rate.

In pre-market trading, stocks across the board are down this morning, but the NASDAQ is taking the bigger hit because of its interest rate sensitivity. Bloomberg’s headline this morning is: “US Inflation Stays Elevated, Adding Pressure for More Fed Hikes.” From the article:

“It could’ve been worse,” said Stephen Stanley, chief US economist at Santander US Capital Markets LLC, noting declines in used-car prices and airfares. However, “as long as shelter costs are going up as rapidly as they have been, it’s going to be tough to get inflation down anywhere close to where the Fed would like to see it.”

The figures, when paired with January’s blowout jobs report and signs of enduring consumer resilience, underscore the durability of the economy — and price pressures — despite aggressive Fed policy.

Richmond Fed President Thomas Barkin was just interviewed on Bloomberg TV, giving his thoughts on the January inflation report. “I just think there is going to be a lot more inertia, a lot more persistence to inflation than maybe we all want,” he said. Watch the interview:

I Bonds: A not-so-simple buying guide for 2023

Confused by I Bonds? Read my Q&A on I Bonds

Let’s ‘try’ to clarify how an I Bond’s interest is calculated

Inflation and I Bonds: Track the variable rate changes

I Bond Manifesto: How this investment can work as an emergency fund

Confused by TIPS? Read my Q&A on TIPS

TIPS in depth: Understand the language

TIPS on the secondary market: Things to consider

Upcoming schedule of TIPS auctions

* * *

Feel free to post comments or questions below. If it is your first-ever comment, it will have to wait for moderation. After that, your comments will automatically appear.Please stay on topic and avoid political tirades.

David Enna is a financial journalist, not a financial adviser. He is not selling or profiting from any investment discussed. I Bonds and TIPS are not “get rich” investments; they are best used for capital preservation and inflation protection. They can be purchased through the Treasury or other providers without fees, commissions or carrying charges. Please do your own research before investing.

Posted in I Bond, Inflation, Investing in TIPS | 55 Comments

This week’s 30-year TIPS auction will be another milestone event

Real yield to maturity could be the highest in 12 years.

By David Enna, Tipswatch.com

The Treasury on Thursday will offer $9 billion at auction for a new 30-year TIPS, CUSIP 912810TP3. The real yield to maturity and coupon rate will be determined by the auction results, but it’s looking like this TIPS will get the highest real yield at auction for this term since at least 2014, possibly back to 2011.

The U.S. Treasury on Friday was estimating the real yield of a 30-year TIPS at 1.53%, up 20 basis points since the beginning of February. If that real yield holds through the auction on Thursday, this new TIPS would get a coupon rate of 1.5%, the highest since an originating auction in February 2011.

Oh no, nostalgia!

Ah, 2011 … that was the year I created Tipswatch.com, with the first post on April 10, 2011. A couple months later I weighed in on a 30-year TIPS reopening auction, for CUSIP 912810QP6. My preview was fairly negative. In the last few months, a few readers have quoted that article back to me to demonstrate how unpredictable the Treasury market can be. (Oh yes, I am fully aware of that.)

That 30-year TIPS auction on April 10,2011, ended up getting a real yield to maturity of 1.744%, which looks outstanding today, but was rather disappointing at the time. Hard to believe, isn’t it? Here is what I said in my preview article:

The auction yield should be around 1.8%, probably a bit higher. This is 110 basis points higher than the going rate on a 10-year TIPS, and a whopping 230 basis points higher than a 5-year TIPS. You will get that yield for 30 years, on a principal base that is constantly increasing with inflation. …

That yield is not great. In fact, this TIPS was first issued four months ago with a base rate of 2.19%. It is likely that the TIPS rates will begin – eventually – moving more toward ‘normal’ levels, and for a 30-year that would be nearly 3%. However, I have been saying that for quite awhile, and I have been wrong.

Why did I say a real yield of 3% was “more normal”? That was based on data available in 2011. The Treasury had stopped issuing 30-year TIPS from October 2001 to February 2010. So this was the total history of 30-year TIPS auctions at the time:

Still, I did invest in CUSIP 912810QP6, which ended up getting a real yield to maturity of 1.744% (a record-low for this term at the time). In 2011, I was disappointed. Today, I am quite happy and I am still holding that TIPS, which has a solid coupon rate of 2.125% and an inflation index of 1.357.

Point of this history lesson: We can’t accurately predict where interest rates are headed. What looked disappointing in 2011 ended up being a prize investment in my TIPS portfolio.

Back to this week’s auction!

For two kinds of investors, a 30-year TIPS with a real yield of 1.50% could be attractive: 1) a buy-and-hold-to-maturity investor who is young enough to survive 30 years, and 2) a TIPS trader who believes that real yields are likely to fall in the relatively near future, which would bring capital gains on a trade.

I am neither 1 nor 2, so I am no longer interested in investing in 30-year TIPS. These TIPS are highly volatile investments and require discipline to hold through wild swings higher or lower in market value.

Although real yields on the secondary market for this term were higher in October 2022, 1.53% remains attractive. Just a year ago, in February 2022, a new 30-year TIPS auctioned with a real yield of 0.195%.

Definition: The “real yield” of a TIPS is its yield above official future U.S. inflation, over the term of the TIPS. So a real yield of 1.53% means an investment in this TIPS will exceed U.S. inflation by 1.53% for 30 years. If inflation averages 2.3%, you’d get a nominal return of 3.83%, on par with a nominal 30-year U.S. Treasury. But if inflation averages 4.5%, you’d get a nominal return of 6.03%.

This chart shows the history of 30-year real yields since the Treasury reinstated the 30-year TIPS in February 2010:

Click on the image for a larger version.

For much of this 13-year period, the 30-year real yield lingered in a range around 1.0%, but keep in mind that real yields were suppressed by the Federal Reserve’s quantitative easing. Now we are in a period of quantitative tightening, and there is no way to predict how long that will last or the eventual result on real yields.

For an investor of the right age looking to build a buy-and-hold TIPS ladder, this 30-year TIPS looks like a reasonable investment. As long as that investor can ignore market volatility, which could be extreme in either direction.

Inflation breakeven rate

With the 30-year nominal Treasury bond closing Friday with a real yield of 3.83%, a new 30-year TIPS with a real yield of 1.53% would have an inflation breakeven rate of 2.3%, a bit higher than recent auctions of this term. But 2.3% looks reasonable. Over the last 30 years, inflation has averaged 2.5% a year. For all 30-year periods beginning in 1971, only one period has had inflation lower than 2.3% — 1990 to 2020 at 2.2%.

Here is the trend in the 30-year inflation breakeven rate from 2010 to 2023:

Click on the image for a larger version.

Final thoughts

I won’t be a buyer, but that is based on my age and ability to hold to maturity. My current TIPS ladder stretches out to February 2043, when I will be approaching 90. I still have some spots to fill, but I will be focusing on TIPS maturing in 5 to 19 years. For example, next month on March 23 we will have a 10-year TIPS reopening auction, and then on April 20 a new 5-year TIPS will be issued.

Investors looking at this new 30-year TIPS should focus on buying it in a tax-deferred account, but because the coupon rate will be around 1.5%, that should be adequate to cover “phantom income taxes” in a taxable account. Investors in a taxable account have to pay taxes on TIPS inflation accruals in the current year.

You can track the Treasury’s daily Yield Curve updates here. Yields are likely to continue to be volatile into next week. This auction closes at noon Thursday for non-competitive orders at TreasuryDirect. If you are putting an order in through a brokerage, make sure to place your order Wednesday or very early Thursday, because brokers cut off auction orders before the noon deadline. I’ll be posting results soon after the auction closes at 1 p.m. ET Thursday.

Here is a history of all 29- to 30-year TIPS auctions over the last eight years:

Confused by TIPS? Read my Q&A on TIPS

TIPS in depth: Understand the language

TIPS on the secondary market: Things to consider

Upcoming schedule of TIPS auctions

* * *

Feel free to post comments or questions below. If it is your first-ever comment, it will have to wait for moderation. After that, your comments will automatically appear.Please stay on topic and avoid political tirades.

David Enna is a financial journalist, not a financial adviser. He is not selling or profiting from any investment discussed. I Bonds and TIPS are not “get rich” investments; they are best used for capital preservation and inflation protection. They can be purchased through the Treasury or other providers without fees, commissions or carrying charges. Please do your own research before investing.

Posted in Inflation, Investing in TIPS, TreasuryDirect | 29 Comments