Your financial adviser should know about I Bonds and be willing to explain their obvious benefits and potential pitfalls.
Tipswatch.com
I consider U.S. Series I Savings Bonds to be among the simplest of all investments. They are savings bonds, after all, issued by the U.S. Treasury and can be purchased in amounts as small as $25. They earn tax-deferred interest and can be held for one year up to 30 years. They can never go down in value.
What could be simpler? Well …
In reality, I Bonds can have some complexities and finding answers to esoteric questions can be difficult. As I Bonds became an investing rage this year, I found myself Googling for answers to questions I had never heard before, and I’ve been writing about I Bonds for 11 years.
Here is a video from Andy Panko, founder of Tenon Financial based in Metuchen, N.J. He is a Certified Financial Planner and an enrolled IRS agent with a specialty in tax advice. Here is how he describes his financial services, for which he charges a flat annual fee ($9,600 for a couple, $8.400 for an individual):
We focus on helping you make the most of your retirement resources in a tax-efficient way. Our specialty is retirement income planning, aka decumulation planning…how to best live off your nest egg and other sources of retirement income. …
Unlike many advisors, our ongoing fee is not tied solely to the amount of your investable assets. The size of your investment accounts is generally a poor gauge of the complexity of your financial life and therefore a poor gauge of the amount of time and resources necessary to provide you proper planning and advice.
I discovered Andy when I came across his Facebook site, Taxes in Retirement, in its early days. The site now has 28,000 members — really active members, and Andy frequently jumps in to answer questions. He also posts frequent YouTube videos on financial topics and has a podcast, Retirement Planning Education.
I like that Andy tells you what he knows, and what he doesn’t know. Here is his discussion on I Bonds:
This video is actually a condensed version of Andy’s podcast, a 30-minute discussion on I Bonds. Here is a direct link to that more detailed version.
By the way, I have no connection to Andy Panko or Tenon Financial and I am sharing this simply because it demonstrates that a financial planner/tax adviser can — and should — understand I Bonds. I appreciate that Andy has taken the time to learn about I Bonds and talk about them with his clients, and with the rest of the world on Facebook, YouTube and podcast services.
Professor Zvi Bodie, who began promoting the I Bond Manifesto last year, came up with an “I-Bond Test of Trustworthiness” this month, wonderful in its simplicity:
Who can you trust for good financial advice and competent management of your personal wealth? Many of us rely on lawyers, accountants, wealth managers, and financial planners. There are two qualities that we ought to look for in any of these financial professionals: integrity and knowledge. Alone, neither of these is sufficient to justify our trust. Asking a simple question provides a quick test of both components of trustworthiness:
What do you think about I Bonds?
If the answer is “What are I Bonds?” then the professional has failed the knowledge part of the test. I Bonds have been in existence since 1998, and at times have clearly dominated all other personal investment opportunities for both the short run and the long run.
The correct answer is “You ought to buy I Bonds up to the legal limit because they are a safe, tax-advantaged liquid asset.”
* * *
Feel free to post comments or questions below. If it is your first-ever comment, it will have to wait for moderation. After that, your comments will automatically appear.
David Enna is a financial journalist, not a financial adviser. He is not selling or profiting from any investment discussed. The investments he discusses can purchased through the Treasury or other providers without fees, commissions or carrying charges. Please do your own research before investing.
Back in December 2021, I wrote an article contending there was a “slim chance” that the fixed rate for the U.S. Series I Bond could rise at the Treasury’s next reset on May 1, 2022. The point of that article was to demonstrate that even if the fixed rate did rise, an investment before May 1 would make more financial sense than one after May 1.
Pre-publication, I ran that article idea by a few inflation-watching experts and got responses like you see on Twitter with the meme of the laughing woman spitting out water. Basically: “Are you crazy? There is no way the Treasury is going to raise the I Bond’s fixed rate in May. Not going to happen!”
At the time, understand, the Federal Reserve was only hinting it might begin raising interest rates in 2022. And the 10-year TIPS had a real yield of -1.08%, giving the I Bond a huge 108-basis-point advantage.
But things have changed, as I speculated could happen in that December article:
Eventually, both real and nominal interest rates should begin rising, ending nearly two years of absurdly low rates, at a time when inflation has surged to a 30-year high. Finally, will investors see a reasonable return on safe investments? That’s my hope.
As of Friday’s market close, the real yield of a 10-year TIPS had increased to -0.08%, jumping 100 basis points higher in just five months. The I Bond now has only an 8-basis-point advantage over a 10-year TIPS. Yet, I’d say the possibility of a higher fixed rate remains very slim — for the May reset. In November, much more likely.
How is the fixed rate set?
The Treasury has no announced formula for setting the I Bond’s fixed rate, and everything you read here is informed speculation. The Treasury sometimes does weird things. I’ve been handicapping the fixed-rate adjustments for 11 years, and my best speculation is that the yield of a 10-year TIPS needs to be above zero for the Treasury to even consider raising the fixed rate. Once the 10-year TIPS real yield rises to about 0.50%, a fixed rate above zero becomes likely. We are still a bit away from that.
I don’t think the fixed rate is going to rise at the May 1 reset. (The announcement will come at 10 a.m. EDT on May 2, because May 1 falls on a Sunday.)
Here is a chart showing every instance where the I Bond’s fixed rate was set higher than zero, going back to 2008, and comparing that fixed rate with the then-current real yields of 5- and 10-year TIPS:
Notice that over the last 13 years, there is no case when the I Bond’s fixed rate was above zero and the 10-year TIPS yield was negative to inflation. The closest was the May 2016 reset, when the 10-year TIPS was yielding only 0.12%. At that time, annual inflation was running at only 1.1%, so the Treasury may have been using the 0.1% fixed rate to spur interest in I Bonds.
Today, U.S. inflation is running at 8.5% and investors are flooding into I Bonds. Over the past six months, nearly $11 billion in I Bonds have been issued, compared with around $1.2 billion during the same period in 2020 and 2021, the Wall Street Journal reported last week.
The I Bond’s next composite rate is going to be 9.62%, even with the fixed rate at 0.0%. The Treasury doesn’t need to spur sales. By all logic, it will be holding the I Bond’s fixed rate at 0.0%. Am I totally certain of that? Nope, more like 98.5% certain. The Treasury sometimes does weird things.
Why buying before May 1 makes the most sense
Let’s say the Treasury surprises us and raises the fixed rate to 0.2% for May to October purchases of I Bonds. That would be a shocker! (It won’t happen, but let’s pretend … ) On a $10,000 investment, that 0.2% bonus is worth $20 in the first year, and will compound slightly higher in future years.
If you invest before May 1, you lock in earnings of $356 in the first six months, and then you will earn $498 in the second six months, for a total of $854 in the first 12 months. If you buy after May 1 and get a fixed rate of 0.2%, you will earn $491 in the first six months and then an unknown amount in the second six months.
If you buy after May 1, you miss out on the initial boost of $356, which is equal to about 13 years of the 0.2% fixed-rate bonus, even if you calculate in compounding. So if you buy in May and luck out with a higher fixed rate, it will still take you 13 years to catch up with the person who bought in April.
Here are the numbers, based on my projection of a gradually declining inflation rate over the next 15 years:
Inflation assumptions in this chart, after Year 1, are just for illustration and are not predictions.
And if the fixed rate doesn’t rise?
A lot of readers have been asking me why it doesn’t make more sense to wait until May and jump directly into the 9.62% rate instead of the current rate of 7.12%. The rationale for buying in April is simple: You get a full six months of 7.12% (annualized) and then a full six months of 9.62% (annualized). With compounding that works out to an annual return of 8.54%.
If you buy after May 1, you get 9.62% annualized for the first six months and then an unknown rate for the next six months. When the variable rate resets in November people who bought in April and those who bought in May will get that new rate for six months. There is no advantage to buying in May, for people who intend to buy I Bonds for the mid- to long-term.
The one exception is for an investor who wants to hold the I Bond exactly 12 months and then redeem it. For that person, buying in May does make some sense because it puts the 9.62% return in the first six months. If the I Bond is redeemed after 12 months, the three-month interest penalty will be applied to the next variable rate, which will probably be lower.
People who buy in April should hold the I Bond for 15 months before redeeming, to make sure the three-month penalty is not applied to the 9.62% rate.
Our fixed rate future
There is no way to predict if the Federal Reserve will have the courage to continue its very aggressive course of planned rate increases and balance-sheet reductions. If it follows through, interest rates should rise across the board. In the last tightening cycle beginning in 2015, the 10-year TIPS real yield rose as high as 1.17% in November 2018. In response, the Treasury set a fixed rate of 0.5% for the I Bond at both the May and November 2018 resets.
The first tick higher in the last tightening cycle came in November 2015, when the I Bond’s fixed rate increased to 0.1%. At that time the 10-year TIPS was yielding 0.63%.
We’ve got a ways to go, but if 10-year real yields rise anywhere close to 0.50% later this year, a higher fixed rate will be possible at the November 2022 reset. This would be positive for I Bond investors, because that fixed rate will continue into January 2023, when the purchase-limit clock resets.
But one more thing to consider: If you see 5- and 10-year TIPS real yields rise well above zero, you need to start considering TIPS as an investment. They will likely have a yield advantage over I Bonds for the first time in nearly three years.
* * *
Feel free to post comments or questions below. If it is your first-ever comment, it will have to wait for moderation. After that, your comments will automatically appear.
David Enna is a financial journalist, not a financial adviser. He is not selling or profiting from any investment discussed. The investments he discusses can purchased through the Treasury or other providers without fees, commissions or carrying charges. Please do your own research before investing.
Inflation breakeven rate soars to 3.34%, probably an all-time high for any TIPS of any term.
By David Enna, Tipswatch.com
The Treasury’s offering today of $20 billion in a new 5-year Treasury Inflation-Protected Security generated a real yield to maturity of -0.340%, the highest for this term at auction in two years and a remarkable 117 basis points higher than a similar auction just four months ago.
This is CUSIP 91282CEJ6, and the Treasury set its coupon rate at 0.125%, the lowest it will go for a TIPS. Investors paid an adjusted price of about $102.76 for about $100.42 of principal, after accrued inflation is added in. This TIPS will have an inflation index of 1.00424 on the settlement date of April 29.
It’s hard — for me at least — to predict real yields of new TIPS at auction, but this result seemed surprisingly high. At yesterday’s market close, the Treasury estimated the real yield of a 5-year TIPS at -0.49%, and a similar TIPS was trading on the secondary market with a real yield of -0.54%. Big-money TIPS investors could be waiting on the sidelines, anticipating higher yields in coming months. But the bid-to-cover ratio for this auction was a decent 2.73, indicating reasonably strong demand.
Today’s auction result continued a several-months trend of new and reopened TIPS getting higher-than-expected yields at auction. For investors, this is a welcome trend.
Definition: The “real yield” of a TIPS is its yield above or below official U.S. inflation, over the term of the TIPS. So a real yield of -0.340% means this TIPS will trail U.S. inflation by 0.34% for 5 years. A negative real yield isn’t necessarily a bad investment; the quality of the investment will depend on whether inflation rises above expectations in future years.
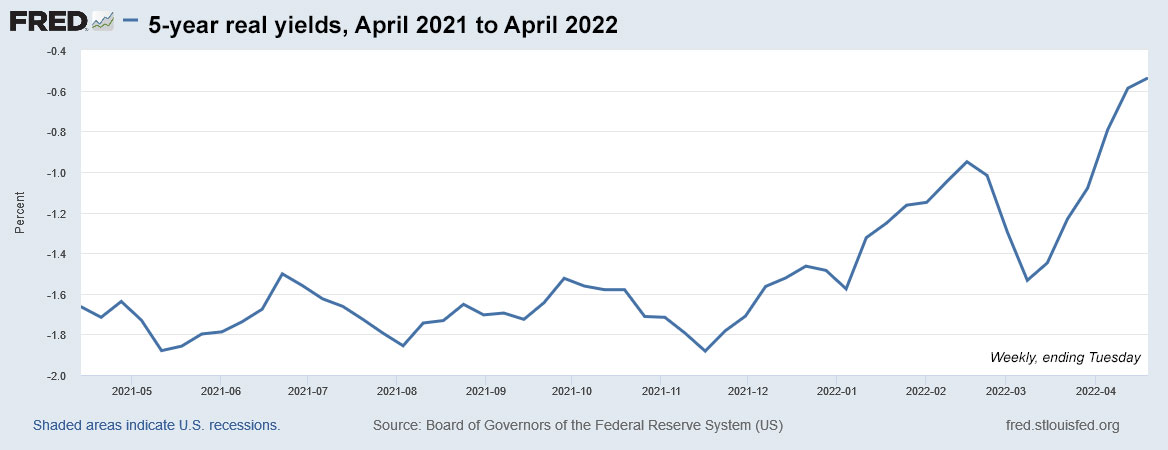
Here is how the 5-year real yield has trended over the last 12 months, based on Treasury estimates:
Inflation breakeven rate
With a 5-year nominal Treasury currently trading with a yield of 3.0%, this TIPS gets an inflation breakeven rate of 3.34%, which I believe is the highest breakeven ever recorded at auction for any TIPS of any term. (I can track data back to 2003.) It shows how much inflation expectations have soared over the last four months. In a December reopening auction of a 5-year TIPS, the inflation breakeven rate was 2.73%, 61 basis points lower.
What does this mean? If inflation averages more than 3.34% over the next 5 years, this TIPS will outperform a nominal Treasury. U.S. inflation is currently running at 8.5% and is likely to remain at least in the 4% to 5% range well into 2023. (Still, I have to admit that a 5-year nominal Treasury paying 3% is starting to get interesting. Might need to mix and match.)
Here is the trend in the 5-year inflation breakeven rate over the last 12 months:
Reaction to the auction
I was a buyer of a nibble-sized investment in this TIPS. While watching yields this morning, I fully expected the yield to come in at -0.50%, 16 or 17 basis points lower. So, nice surprise. In addition, this TIPS (along with all other TIPS) will get an inflation accrual of about 1.3% in May, based on non-seasonally adjusted inflation in March.
After the auction’s close, I noticed news reports that Fed Chairman Jay Powell had signaled in Europe that the Fed is highly likely to raise short-term interest rates by 50 basis points in May. “It is appropriate,” he said, “to be moving more quickly. … I would say 50 basis points will be on the table for the May meeting.” This comment certainly had an effect on Thursday’s auction. The 5-year TIPS is the maturity most sensitive to increases in short-term nominal rates.
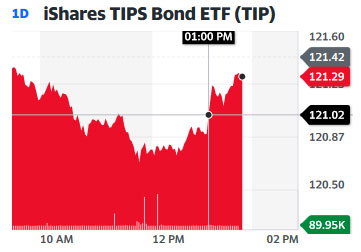
The TIP ETF — which holds the full range of maturities — had been trading slightly lower all morning, indicating higher yields, and then popped a bit higher after the auction close. This indicates the market saw the auction as acceptable.
We are entering a new phase in Treasury issues, with the Federal Reserve no longer buying TIPS on the open market as part of quantitative easing, and also preparing to slim its balance sheet in upcoming months. Higher yields should be coming. But the market is already pricing in the Fed’s future actions.
I am speculating that big-money investors — pensions, hedge funds, foreign central banks — won’t be bidding TIPS yields lower until we see the rate-rising-trend stabilize. I believe we will see the 5-year real yield climb above zero later this year.
CUSIP 91282CEJ6 will get a reopening auction in June and then the Treasury will auction another new 5-year TIPS in October and reopen that one in December. Here is the history of recent TIPS auctions of this term, showing how 5-year real yields climbed substantially higher during the Fed’s last tightening cycle in 2017 to 2018:
* * *
Feel free to post comments or questions below. If it is your first-ever comment, it will have to wait for moderation. After that, your comments will automatically appear.
David Enna is a financial journalist, not a financial adviser. He is not selling or profiting from any investment discussed. The investments he discusses can purchased through the Treasury or other providers without fees, commissions or carrying charges. Please do your own research before investing.
Despite its negative real yield at auction, this TIPS performed very well.
By David Enna, Tipswatch.com
On April 15, 2022, a 5-year TIPS — CUSIP 912828X39 — matured. It was first auctioned on April 20, 2017, with a real yield to maturity just slightly negative to future inflation, at -0.049%. The coupon rate was set at 0.125%,
Here’s the question: How did CUSIP 912828X39 do as an investment versus a nominal 5-year Treasury? It turns out it did quite well.
I’ve been writing about Treasury Inflation-Protected Securities since 2011, and I’ve been investing in these products since 1999. I track the performance of every maturing 10-year and 5-year TIPS, as they mature in January, April and July. For more on this, see my ‘Tips vs. Nominals‘ page.
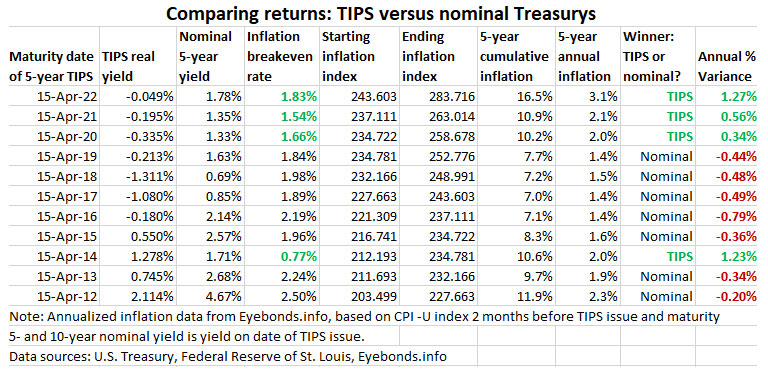
On the day CUSIP 912828X39 was auctioned, a nominal 5-year Treasury was yielding 1.78%, setting up a 5-year inflation breakeven rate of 1.83% for this new TIPS. As it turned out, thanks to some lofty inflation numbers in recent months, inflation over those 5 years averaged 3.1%. The TIPS investment ended up being the winner, by a fairly large margin — an annual bonus of 1.27%.
(I didn’t buy this TIPS at the originating auction, but I did end up investing in CUSIP 912828X39 at the December 2017 reopening auction, when the real yield to maturity was a more attractive 0.370%. I invested $10,000 and ended up getting $11,609.90 at maturity, plus the 0.125% coupon along the way.)
TIPS have been under-performing nominal Treasurys for most of the last decade because inflation for much of that time ran lower than expectations. We seem to have turned the corner on that, with official U.S. inflation now running at 8.5%, much higher than expectations. Will that trend continue? It seems likely, for awhile at least.
Here is how 5-year TIPS have performed versus 5-year Treasury notes for all maturities since April 2012:
Annualized inflation data from Eyebonds.info, based on CPI-U index 2 months before TIPS issue and maturity. Chart shows only new issues.
Notes and qualifications
This chart is an estimate of performance, because it uses a full month of inflation in the ending month, when actually TIPS accruals are based on a half month for the first and last months, with the origination and maturity occurring on the 15th of the month.
Keep in mind that interest on a nominal Treasury and the TIPS coupon rate is paid out as current-year income and not reinvested. So in the case of a nominal Treasury, the interest earned could be reinvested elsewhere, which would potentially boost the gain. For certain, we don’t know what the investor could have earned precisely on an investment after re-investments.
In the case of a TIPS, the inflation adjustment compounds over time, and that will give TIPS a slight boost in return that isn’t reflected in the “average inflation” numbers presented in the chart.
* * *
Feel free to post comments or questions below. If it is your first-ever comment, it will have to wait for moderation. After that, your comments will automatically appear.
David Enna is a financial journalist, not a financial adviser. He is not selling or profiting from any investment discussed. The investments he discusses can purchased through the Treasury or other providers without fees, commissions or carrying charges. Please do your own research before investing.
I Bonds remain the preferred inflation-protected investment. But a 5-year TIPS could be an addition to your inflation-fighting arsenal.
By David Enna, Tipswatch.com
The U.S. Treasury will offer $20 billion in a new 5-year Treasury Inflation Protected Security at auction on Thursday. This is CUSIP 91282CEJ6, and the coupon rate and real yield to maturity will be set by the auction results.
As of Thursday’s market close (no data for Good Friday), the Treasury estimated the real yield of a 5-year TIPS at -0.54%, a remarkable 104 basis points higher than where we started this year. Real yields — especially for shorter- and medium-term TIPS — have been surging in response to the Federal Reserve’s commitment to raise short-term nominal rates and also begin reducing its huge balance sheet of U.S. Treasurys.
The Fed stopped buying TIPS and other Treasurys in mid March and also “generally agreed” that it is prepared to reduce its balance sheet of Treasury issues by up to $60 billion a month. This could possibly begin in May. The result “should” be higher interest rates across all maturities.
Consider this: In Thursday’s auction, the Treasury will be offering $20 billion in a new 5-year TIPS, the highest auction amount in history for this term, and up 10% from the same offering a year ago. But at the same time, the Treasury won’t be adding TIPS to its balance sheet, and is preparing to let its balance sheet decline, meaning no reinvestment. Again, this “should” result in higher interest rates.
If the history of the last tightening cycle repeats itself, we should see 5-year TIPS real yields rise at least another 100 basis points. But that forecast is highly uncertain, because if inflation continues surging then demand for TIPS will be very strong, which will support yields at this level. On the other hand, if the U.S. economy sinks into recession, the Fed will likely launch another era of stimulus, and 5-year real yields could sink deeply negative.
Got it? The future is uncertain.
For that reason, I am not opposed to nibbling into this auction, if 5-year real yields hold in the -0.50% range this week. The one great thing about a 5-year TIPS is that the term is only 5 years. Even though you’ll pay a premium price, you probably won’t lose money and could do decently if inflation continues at a moderately high pace.
But wait, how can you lose money on a TIPS, an investment that guarantees return of your original par value? That’s true in “normal” times, when TIPS have real yields positive to inflation. In the current market, with negative real yields, buyers pay a premium price over par to invest in TIPS, and the premium is not guaranteed to be returned at maturity. I don’t think this has ever happened in TIPS history, but it is “possible.”
Here is a history of the 5-year real yield over the last five years, showing how the yield surged to an attractive level (around 1.0%) during the closing days of tightening in late 2018 and then plummeted in response to the Fed’s quantitative easing following the pandemic surge of March 2020:
What to expect
Definition: The “real yield” of a TIPS is its yield above or below official U.S. inflation, over the term of the TIPS. So a real yield of -0.54% means this TIPS will trail U.S. inflation by 0.54% for 5 years. A negative real yield isn’t necessarily a bad investment; the quality of the investment will depend on whether inflation rises above expectations in future years.
If the real yield holds at around -0.54% at Thursday’s auction, the coupon rate will be set at 0.125%, the lowest the Treasury will go for any TIPS. That means investors will be paying a premium price, because the real yield to maturity will be much lower than the coupon rate. The price should be roughly about $103.70 for $100.42 of value, after accrued inflation is added in. The inflation index will be 1.00424 on the settlement date of April 29.
Key point: Investors also know that in May, principal balances for this TIPS will get an immediate boost in value of 1.34%, the rate of non-seasonally adjusted inflation in March. That’s pretty appealing. I’m expecting demand to be reasonably strong, but recent TIPS auctions have received lukewarm investor interest.
Inflation breakeven rate
With a 5-year nominal Treasury closing last week at 2.79%, this TIPS has a current estimated 5-year inflation breakeven rate of 3.33%, a rather lofty number. That means that for this TIPS to outperform a nominal Treasury of the same term, inflation would have to average 3.33% over the next 5 years. I think investors are front-loading a lot of inflation in 2022, but then see it dropping to a rate of 4% to 5% by the end of the year. After that …. er … the future is uncertain.
I can track 5-year inflation breakeven rates back to 2003, and at no time — until the last several months — has the 5-year inflation expectation ever exceeded 3%. We have entered a new era.
The inflation breakeven number is important because it tells you the relative cost of a TIPS investment. A high inflation breakeven rate — anything above 2.75% — means a TIPS is “expensive” versus a nominal Treasury of the same term. We are well above “expensive” at this point, but rightly so with U.S. inflation currently running at a annual rate of 8.5%.
Here is the trend in the five-year inflation breakeven rate over the last five years, showing the surge higher in the aftermath of aggressive economic stimulus by both the Fed and Congress in the wake of the pandemic surge two years ago:
Obvious alternative: I Bonds
Over the last two years, I have recommended putting your first $10,000 inflation-protected investment (per person) into I Bonds, which have an effective real yield of 0.0%, currently 54 basis points higher than a 5-year TIPS. In essence, I Bonds would be about 3.3% more valuable than a 5-year TIPS, if I Bonds could be traded on an open market (they can’t be).
I Bonds remain the superior investment, across pretty much the entire TIPS maturity spectrum, since I Bonds can be redeemed after five years with no penalty, or held for 30 years if that is what you desire. Plus, taxes on the interest is tax-deferred, and I Bonds provide better deflation protection.
However … there is always a however … things will change when and if real yields on TIPS rise well above zero. At that point, the equation shifts toward individual TIPS, because there is no annual purchase limit. I’d still buy I Bonds, though. I always buy I Bonds, just in case we hit a bizarre scenario like we are seeing in April 2022: high inflation and very low nominal rates.
Another investment to consider for the future is 5-year insured bank CDs, which even at the best-in-nation banks are now paying a pathetic 2.0%, well below the 5-year Treasury note at 2.79%. In my opinion, this is a scandal, but the National Enquirer won’t be doing any front page stories on it. If you are thinking about a bank CD, it’s probably still better to look at 1-year CDs and try to get more than 1% in a time of 8.5% inflation. Or, even better, the 2-year nominal Treasury is paying 2.47% right now; it is the “sweet spot” of the nominal Treasury curve.
Conclusion
This 5-year TIPS auction, viewed outside of the current Fed hiking trend, is ugly but attractive enough. I might chip in with a small (very small) purchase to keep my TIPS ladder interesting. Higher real yields seem highly likely in the future, but as I seem to say often … the future is uncertain.
This auction closes for non-competitive bids at TreasuryDirect at noon EDT on Thursday. If you are buying through a brokerage account, you should make your purchase either Wednesday evening or early Thursday, because auction orders close early at brokerages. I will be posing the auction results soon after it closes at 1 p.m. EDT Thursday.
Here is a history of 4- to 5-year TIPS auctions over recent years. Notice that at the tail-end of the last Fed tightening cycle a 5-year TIPS reopening on December 20, 2018, generated a real yield of 1.129%. Eventually, we could be heading there?
* * *
Feel free to post comments or questions below. If it is your first-ever comment, it will have to wait for moderation. After that, your comments will automatically appear.
David Enna is a financial journalist, not a financial adviser. He is not selling or profiting from any investment discussed. The investments he discusses can purchased through the Treasury or other providers without fees, commissions or carrying charges. Please do your own research before investing.


It works and offers more information than you'd find on Bloomberg's Current Yields page. (I have a watchlist at Bloomberg…